IsGISAXS - Version 2.6

IsGISAXS :


a tool for Grazing Incidence Small Angle X-ray Scattering analysis for nanostructures

Version 2.6


Rémi Lazzari


Institut des NanoSciences de Paris
Oxydes en basses dimensions
CNRS-Université- PARIS VI et VII
Campus Boucicaut
140 Rue de Lourmel
75015 Paris, France
Tel : (33)-1-44-27-46-28
Fax : (33)-1-43-54-28-78
lazzari@insp.jussieu.fr
https://w3.insp.jussieu.fr


IsGISAXS web site : https://w3.insp.jussieu.fr/


Contents

1  Introduction
2  A few words about the GISAXS scattering cross section
    2.1  The scattering geometry
    2.2  The scattered intensity : analysis in terms of particle form factor and interference function
        2.2.1  Decoupling Appproximation
        2.2.2  The Local Monodisperse Approximation
        2.2.3  The Size-Spacing Correlation Approximation
        2.2.4  Incident beam coherence effect
    2.3  The Born form factor
        2.3.1  Simple geometrical objects
        2.3.2  Orientation and size distributions
        2.3.3  The core-shell particle
    2.4  The form factor within the Distorted Wave Born Approximation
        2.4.1  Islands on a substrate or on overlayer
        2.4.2  Inclusions in a substrate or under a layer
        2.4.3  Holes in a substrate
        2.4.4  Particles encapsulated in a layer
        2.4.5  Holes in a layer
        2.4.6  The DWBA on the graded interface
    2.5  The interference function
        2.5.1  The pair correlation function
        2.5.2  The regular bidimensional lattice
        2.5.3  The bidimensional ideal paracrystal
    2.6  The reflectivity from a layer of particles
3  How to use the IsGISAXS software ?
    3.1  The IsGISAXS software environment and outputs
    3.2  Description of the input file *.inp and the underlying parameters
        3.2.1  The file contents
        3.2.2  Some useful remarks
    3.3  The morphology file *.mor
    3.4  The treatment of experimental data *.dat and the fit file *.fit
        3.4.1  The *.fit file
        3.4.2  The *.dat file
        3.4.3  Using linear constraints between parameters : the *.mat file
    3.5  The batch file *.bah
    3.6  The Quick Fit option
    3.7  The output files *.out,*.pro,*.ima,*.ki2,*.cor,*.dwba,*.bin
IsGISAXS : Typical examples and capabilities
    4.1  The form factor
        4.1.1  Distorted Wave Born Approximation and the refraction effect
        4.1.2  The island facetting
        4.1.3  The island sizes distribution
    4.2  The interference function
        4.2.1  Non regular lattice and the pair correlation function
        4.2.2  Regular lattice
        4.2.3  Paracrystal
        4.2.4  The reflectivity
5  Future developments-improvements
6  License agreement


Chapter 1
Introduction

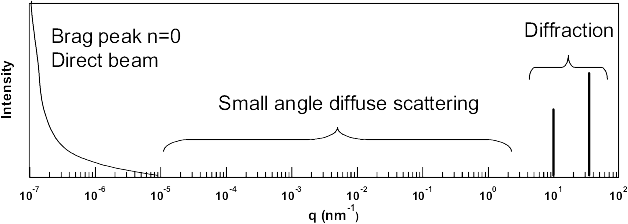
The techniques of elastic scattering of radiations, in particular X-rays or neutrons, are widely used in the field of condensed matter as they provide invaluable tools to probe the order properties of matter. What could be called the "diffraction range" is reached when the inverse of the wavevector transfer (q=4p/lsin(q)) is closed to interatomic distance i.e. at wide angles. By a careful analysis of the integrated diffracted intensities, one can access to the intimate atomic structure i.e. the positions of nuclei and the spread of the electronic cloud around atoms. The "diffuse scattering" encountered around Bragg peaks give some insights about the disorder in the studied system ; but its analysis requires suitable models of disorder in order to extract statistical information at length scale greater than the interatomic distances. A peculiar case of "diffuse scattering" is provided by the small angle scattering measurements around the q=0 central peak. This domain is restricted in between the direct beam and the first diffraction peaks (see Fig. 1.1). With X-rays or neutrons with a wavelength of a few angstroms, this domain of small wavevector transfer is reached in the small angle range. The scattering at small angles with X-rays [1,2] or neutrons [3,4] is a well established and widespread technique which allows to get structural information in the range 1-1000 nm. The typical probed sizes imply that the wave-matter interaction at the atomic scale can be ignored. The scattering comes essentially from strong variations of the mean electronic density for X-rays or the mean scattering lengths for neutrons; an homogeneous medium does not scatter except in the specular rod. However, one has to keep in mind that scattering and diffraction are two intimately linked phenomena as they are answerable to the same wave-matter interaction.
figures/chap1/scatt.gif
Figure 1.1: The scattering and diffraction ranges versus the wavevector transfer.
Up to fifteen years ago, the scattering techniques were limited to three dimensional samples as the strong penetration depth of the radiations and the low signal to noise ratio hampered the surface sensitivity. Quite recently, thanks to the increasingly use of synchrotron radiation, these techniques [5,6] were extended to surface geometry using the phenomenon of total external reflection of X-rays in the grazing incidence range. The diffraction used in surface science allows to get accurate information on reconstruction of surfaces, surface relaxation, buckling and on the atomic position [7,8] thanks to the precise measurements of crystal truncation rods (CTR). Epitaxies, relaxation of stress, absorption sites and even maps of strains in real space [7,9] can be obtained for deposit on a surface. In this respect, the field of semiconductors and thin films growth brought a need of knowledge about layer structure and morphology and sizes of quantum dots, supported islands or buried particles which has pushed towards the development of Grazing Incidence Small Angle X-Ray Scattering (GISAXS). The specular reflectivity technique provides only information about the dependence of the electronic density perpendicular to the surface, the first obvious one being the measurement of layer thickness through the spacing of Kiessig fringes. On the contrary with off-specular measurements either in reflectivity geometry or in GISAXS, valuable information can be extracted from the scattering curves like the roughness of a surface [10,11,12,13], the lateral correlations, sizes and shapes of semiconductors dots [14,15,16,17,18], of metallic islands [19,20,21] or of the self organized dots superlattices [22,23,24] or wires [25]. Such information are of prime interest in understanding the link between morphology and physical or chemical properties like light emission in quantum dots or catalytic properties of clusters, or more fundamentally in understanding the phenomenon of layer growth. Even though, the near-field microscopies can give some answers to these questions for surfaces, X-rays present several advantages: (i) they give an averaged statistical information over the whole sample surface (ii) they can be applied in various environments ranging from ultra-high vacuum to gas atmospheres and in situ and in quasi real time when kinetics phenomena are involved (iii) using the variable probed depth as function of the incidence angle, X-rays offer the opportunity to characterize from surface roughness to buried particles or interfaces. By combining the advantages of synchrotron radiation and two-dimensional detectors with an in situ sample preparation, the full potentiality of such a method can be obtained. Thus, quite recently, some experiments [21] used the GISAXS technique to characterize in situ and in ultra-high vacuum the growth process of metal/oxide interfaces and of self organized cobalt clusters on the herringbone reconstruction Au(111) surface. The quality of the data with a very low background opens the way to a real quantitative analysis, even in the very thin film range.
Up to now, the GISAXS data analysis was often performed in a crude way forgetting either the reflection-refraction effects in the simple Born approximation or the interplay between interference function and form factor or the particle size distributions. For instance, most of the time for particles, the interparticle spacing is directly extracted from the "Bragg" law, method which could induce up to 30% of error. Moreover, concerning particle size, the coupling between the interference function and form factor greatly increases the complexity of the analysis and prevents the use of classical Guinier approach. Moreover, the Porod's measurement is hampered by the low signal/noise ratio at high wavevector transfer. Therefore, only direct modelling of the data is appropriate. In fact, the needed theoretical background is simply derived from classical small angle scattering [1,2]. A peculiar attention has to be payed at the refraction of the beam at the surface due to the grazing incidence and emergence geometry. The theoretical treatment in Distorted Wave Born Approximation was recently derived for rough surfaces [10,11,12,13,6], buried particles [26] and supported islands [27]. The use of such a theory is mandatory, as it will be shown herein, for describing correctly the influence of the substrate in the scattering phenomenon.
However a program for easily analyzing data and simulating off-specular scattering is still lacking in the rapidly growing field of GISAXS. The aim of this instructions is to give the main theoretical elements enclosed in the program IsGISAXS  [281 and to give an overview of its use. This manual is not intended to give a review of the GISAXS technique and or of the diffuse X-ray scattering literature [29]. Moreover, as each sample morphology gives rise to a different scattering pattern, it is impossible to cover each case. Thus, IsGISAXS was restricted to the study of GISAXS from particles in two dimensions (see the first GISAXS experiments by Levine and coworkers [30]). Diffuse scattering from rough surface or multilayers is not treated.
In a first theoretical part, the scattering cross section is reminded and decomposed in terms of form factor of the particle and interference function. The geometry is restricted, on purpose, to two dimensions and the scatterers are supposed to belong to the same plane. In order to have tractable expressions, approximations are described for the size-distance coupling: the Decoupling Approximation (DA), the Local Monodisperse Approximation (LMA) and the Size-Spacing Correlation Approximation (SSCA). For each particle morphology, the expressions of the form factor is given in the DWBA. The implemented interference functions cover the problem of uncorrelated particles characterized by their pair-correlation function, that of ideal paracrystal with loss of long range order and that of regular or defective lattice.
In a second part, the use of IsGISAXS is explained and a detailed description of the input files and of the possible outputs is given. In the last part, the capabilities of the software are illustrated with various types of examples which originally motivated the elaboration of such a program [21].


Chapter 2
A few words about the GISAXS scattering cross section

The aim of this chapter is to give a flavor of the needed theoretical background to calculate the cross section in the case of scattering (under grazing incidence geometry) of an electromagnetic wave by a plane of nanoparticles close to the surface of a substrate. The term "particle" stands for islands, inclusions or holes. The herein developed formalism is completely equivalent for Grazing Incidence Small Angle X-Rays Scattering (GISAXS) and Grazing Incidence Small Angle Neutron Scattering (GISANS).
The crystallography convention of plane waves expi(wt - k.r) and Fourier transform
F(q) = ó
õ
exp(iq.r) f(r) d3 r
(2.1)
is used all over the manual and the program. It leads the n=1- d- i b writing of the refraction index with d,b > 0.

2.1  The scattering geometry

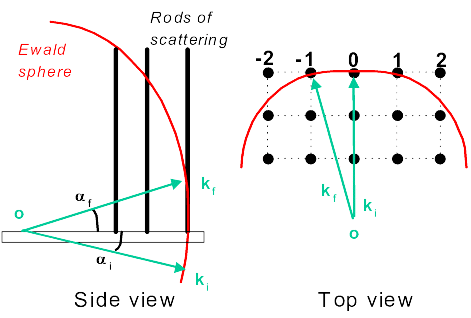
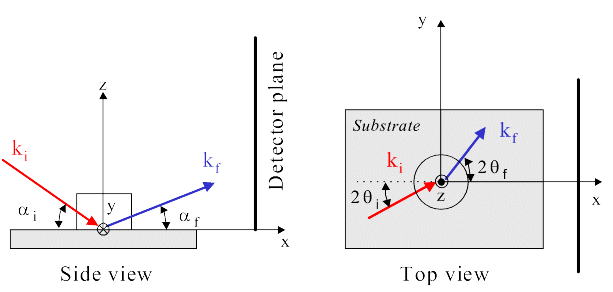
In a grazing incidence experiment (see Fig. 2.1), a monochromatic X-rays beam of wavevector ki (wavelength l - wave number k0=[(2p)/(l)]) is sent onto a surface under an incident angle ai in the range of a few tenth of degrees. Possibly, the in-plane direction of the incident beam 2qi is different from zero. The reference cartesian frame is defined by its origin on the surface, its z-axis pointing upwards, its x-axis perpendicular to the detector plane and its y-axis along it. The X-ray beam is scattered along kf in the direction (2qf,af) by any type of roughness or electronic contrast variation, on the surface or under surface. Because of energy conservation, the scattering wave vector q defined by:
q = 2p

l
æ
ç
ç
ç
è
cos(af)cos(2qf)-cos(ai)cos(2qi)
cos(af)sin(2qf)-cos(ai)sin(2qi)
sin(af)+sin(ai)
ö
÷
÷
÷
ø
(2.2)
is the central quantity in the scattering process.
figures/chap1/geometry.gif
Figure 2.1: The grazing incidence geometry: an incident wave of wavevector ki is scattered in the direction kf.
The scattering intensity is recorded on a plane ensuring that the angles are in the few degrees range and thus enabling the study of lateral sizes of a few nanometers. The detector can be punctual (0D), linear (1D) or even bidimensional (2D). The direct beam is often suppressed by a beam stop to avoid the detector saturation as several orders of magnitude in intensity separate the diffuse scattering from the specular reflectivity.

2.2  The scattered intensity : analysis in terms of particle form factor and interference function

The goal of this section is to compute the scattering cross section defined by:
dS

dW
(q) = N

N I0 DW
,
(2.3)
with N the number of photons scattered per second into the solid angle DW around (2qf,af), I0 the flux of incident photons and N the total number of scatterers i.e. particles.
On a perfectly flat surface, all the intensity is concentrated in the specular rod. In fact, the off-specular scattering appears when any type of surface roughness, scattering entity or contrast variation is present on the surface. In the actual case, the roughness is restricted to small particles on a surface, to a plane of clusters embedded in a host matrix or to holes in substrate with well defined geometrical shapes. Each particle is characterized by its position on the substrate Ri|| and its shape function Si(r) equal to one inside the object and zero outside. The scattering density (electronic density) is given by:
r(r) = r0
å
i 
Si(r) Äd(r-Ri||),
(2.4)
where Ä is the notation for the convolution product and r0 is the mean electronic density. This writing implicitly implies that the exact distribution of electrons around the nuclei is of no special interest in the small wavevector transfer regime.
In the framework of the kinematic approximation, the scattered cross section is proportional to the modulus square of the Fourier transform of the electronic density. The polarization state of X-rays leads to a term in:
P = ì
ï
ï
í
ï
ï
î
1
s-polarization
cos2y
p-polarization
1

2
(1+cos2y)
unpolarized
(2.5)
with cosy = ki.kf/k02. However, it can be dropped out safely as the scattering angles are small. Thus, by normalizing to the mean electronic density and by the classical Thomson scattering cross section re2, the scattering cross section ds/dW(q) can be written as:
ds

dW
(q)
=
1

re2r02
dS

dW
(q) = 1

N
ê
ê

å
i 
Fi(q)  exp(iq·Ri||) ê
ê
2
 
=
1

N

å
i 

å
j 
Fi(q) Fj,*(q)exp[iq·(Ri||-Rj||)].
(2.6)
In the simple Born approximation (BA), Fi is the Fourier transform of the shape function:
Fi = ó
õ


Si 
exp( iq ·r)  d3r.
(2.7)
If the reflection-refraction effects at interfaces have to be accounted for, Fi has to be computed in the Distorted Wave Born Approximation (DWBA) and has a more complex expression (see Sect. 2.4). By isolating the i=j term, one finds:
N ds

dW
(q) =
å
i 
|Fi(q)|2 +
å
i,j ¹ i 
Fi(q) Fj *(q)exp[iq·(Ri||-Ri||)].
(2.8)
If only the statistical quantities [31] are known for the system under concern (i.e. the size distribution and the position disorder), one has can transform the previous expression Eq. (2.8) in a continuous integral:
ds

dW
(q) =
å
a 
pa |Fa(q)|2 + rS

S

å
a, b 
papb   Fa(q) F*b(q)
(2.9)
ó
õ
ó
õ


S 
d2Ria d2Rjb   Gab(Ria||,Rjb||) exp[iq·(Ria||-Rjb||) ].
rS is the number of particles per unit of surface. S is the surface sampled coherently by the beam. The particles have been sorted out in classes a of sizes and shapes with an occurrence probability pa. The probability per unit of surface to find a particle of class a in Ri|| knowing that there is a particle of class b in Rj|| is called rS2 papb   Gab(Ria||,Rjb||). Gab(Ria||,Rjb||) is known as the partial pair correlation function. The condition i ¹ j of Eq. (2.8) is of course implicitly included in this function as a hard core type effect. In practice, the previous equation is unusable as it implies the knowledge of all the Ga,b. The equation Eq. (2.8) have been directly implemented in the program IsGISAXS for simulating GISAXS results from known morphologies, like from transmission electron or near field microscopies pictures (see *.mor file description Sect. 3.3). To go further on, when the morphology is not exactly known, or when data fitting is involved, some hypothesis need to be made.

2.2.1  Decoupling Appproximation

A current hypothesis called Decoupling Approximation (DA) is to suppose that the king of the scatterers and their positions are not correlated in such a way that the partial pair correlation functions depend only on the relative positions of the scatterers (homogeneous system) and not on the class kind:
Gab(Ria||,Rjb||) @ g(Rij||).
(2.10)
This genuine random substitutional mixture leads to:
ds

dW
(q)
@
< |Fa(q)|2 > a
(2.11)
+
| < F(q) > a |2 rS ó
õ
d2Rij   g(Rij||)exp[iq·Rij|| ],
where < ¼ > a is the mean value over the size-shape distribution. Finally, like for the isotope effect in neutron scattering, the cross section appears as the sum of two terms, a coherent one and a diffuse one:
ds

dW
(q) @ Id(q) + | < F(q) > a|2 ×S(q)
(2.12)
Id(q) = < |F(q)|2 > a - | < F(q) > a|2
(2.13)
S(q) = 1 + rS ó
õ
d2Rij   g(Rij||) exp[iq·Rij|| ].
(2.14)
Id(q) is the diffuse part of the scattering which is linked to the disorder of the scattering objects (size, shape). S(q) is the total interference function; it describes the statistical distribution of the objects on the surface and thus their lateral correlations. It is the Fourier transform of the particle position autocorrelation function:
z(r) = 1

N

å
i,j 
d(r-ri)Äd(r-rj) = d(r) +
å
i ¹ j 
d(r-ri + rj).
(2.15)
S(q) will be detailed in the following.

2.2.2  The Local Monodisperse Approximation

To partially account for the coupling between the position and the kind of the particles, the Local Monodisperse Approximation (LMA) is often used in the literature. It consists in replacing the scattering weight of each particle by its mean value over the size distribution:
ds

dW
(q) @ < |F(q)|2 > a ×S(q).
(2.16)
This expression is asymptotically equal for large q to the Decoupling Approximation as:
S(q) \buildrelq ® ¥

@
1.
(2.17)
This approximation is obtained from Eq. (2.8) by supposing that, over the coherent X-ray domain, all the particles for each origin particle are, approximatively, of the same size in such a way that the size-shape of the scatterers vary slowly across the sample. In some way, in the LMA, the intensity originates from an incoherent sums of the scattering intensities from monodisperse subsystems weighted by the size-shape probabilities.

2.2.3  The Size-Spacing Correlation Approximation

The conclude, the treatment of the partial pair correlation and interference functions is, by far, the most delicate point in the quantitative analysis of experimental data as it varies from one situation to an other leading to strong variations of the scattered intensities in particular close to the specular rod (see Chap. 4 and Ref. [32]).
An attempt to rationalize the problem of correlations between particles was made using the 1D paracrystal model (see below)(i) in Ref. [33] with 1D particles and various correlation schemes (size-size, size-spacing, size-spacing disorder) and (ii) in Ref. [34] with 3D particles to tackle the problem of size-spacing correlation int the GISAXS from islands on a surface. The development of the SSCA (Size-Spacing Correlation Approximation) model is beyond the scope of this manual and the interested reader is advised to refer to the literature [33,34]. For short, size dispersed particles are aligned along a chain in the same spirit as in the Hoseman paracrystal (see Sect. 2.5.3 for further explanation). The chain is built step by step in a cumulative way by putting each particle at a distance dn of its neighbor with a probability density of distance p(dn) that depends of the sizes of the two neighbors n-1 and n. More exactly, the mean value of dn is chosen to depend linearly on the size of the two neighbors:
< dn > = D + k[Rn-1 + Rn - 2 < Rn > ]
(2.18)
k > 0 is the SSCA coupling parameter that introduces an hard core effect between the Voronoï cells of the particles. Using the scattering density autocorrelation function, the total scattered intensity reads:
ds

dW
(q)
@
~
z
 

0 
(q^) d(q||) + | < F(q||,q^) > |2 + 2 Real ì
í
î
~
F
 

k 
( q||,q^)
~
F*
 

k 
(q||,q^) Wk( q||)

~
p
 

2k 
(q||) [1- Wk( q||)]
ü
ý
þ
(2.19)
Wk( q||)
=
~
p
 

2k 
(q||) f(q||) eiq||D
(2.20)
The characteristic function of the particle size distribution evaluated was introduced in the previous equation:
~
p
 

k 
(q||) = ó
õ
p(a) ei kq|| DR||(a) da
(2.21)
f(q||) eiq||D is nothing else than the characteristic function of the underlying 1D paracrystal (see Sect. 2.5.3). [(F)\tilde]k(q||) defined as:
~
F
 

k 
(q||,q^) = ó
õ
p(a) F(q||,q^,a) ei kq|| DR||(a) da
(2.22)
is a generalization of the particle form factor averaged over the size-shape distribution.
More details can be found in Refs. [33,34]

2.2.4  Incident beam coherence effect

If the incident beam has a finite divergence (distribution on (2qi,ai)) and wavelength resolution i.e. a finite coherence length, for each scattering directions (2qf,af), one has to perform an incoherent sum of the intensity scattered by each plane wave with a weight p(l) p(2qi) p(ai):
d
^
s
 

dW
(q) = ó
õ


l 
ó
õ


qi 
ó
õ


ai 
d
~
s
 

dW
(q,l,2qi,ai) p(l) p(2qi) p(ai)  dldqi dai .
(2.23)

2.3  The Born form factor

2.3.1  Simple geometrical objects

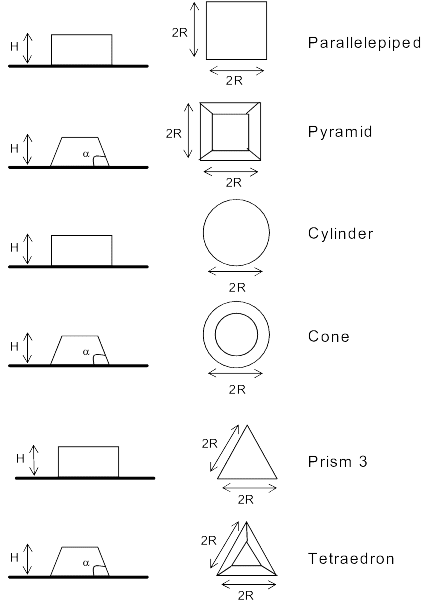
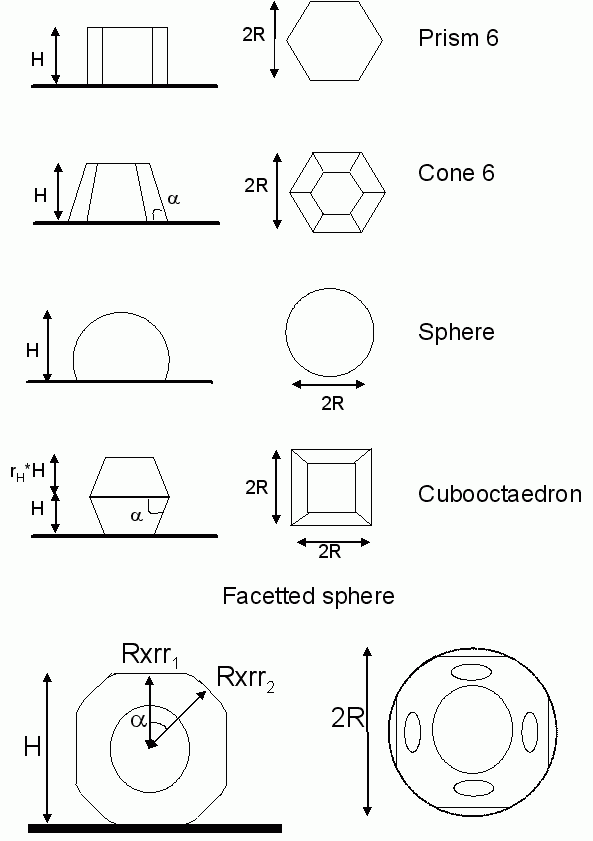
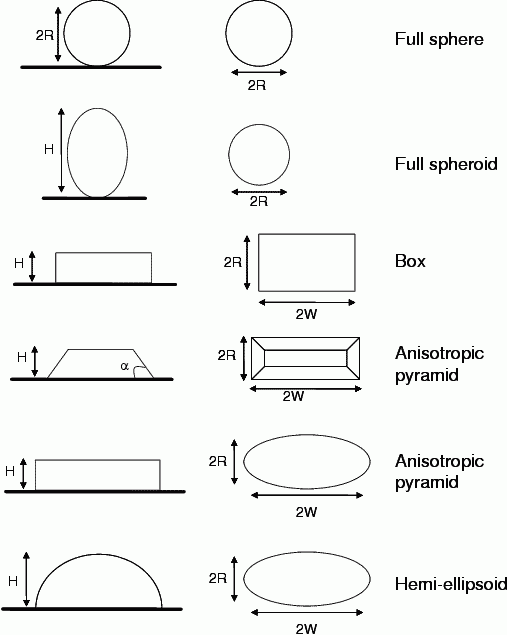
The form factor Eq. (2.7) is only the Fourier transform of the shape of the particle. In some peculiar cases with special symmetries, the 3D-integral can be reduced to 1D-integral or even expressed analytically. The shape depicted in Fig. 2.2-2.3-2.4 are supported in the IsGISAXS program.
figures/chap1/form.gif
Figure 2.2: Supported geometries for particle shapes in IsGISAXS (Left: side view - Right: top view).
figures/chap1/form1.gif
Figure 2.3: Supported geometries for particle shapes in IsGISAXS (Left: side view - Right: top view).
figures/chap1/form2.gif
Figure 2.4: Supported geometries for particle shapes in IsGISAXS .
In the cartesian frame attached to each particle with its origin at the center of the bottom of the particle, with its x-axis aligned along one side of the particle, and with its z-axis pointing upwards, the mathematical expressions for the form factor F(qx,qy) as well as the particle volume V, the particle surface seen from above S and the gyration radius (along z) Rg are the following: with sinc(x)=sin(x)/x the cardinal sine, J1(x) the Bessel function of first order.
Except for the facetted sphere or simple shapes for which the form factor can be expressed analytically, the 1D-integration is performed, in IsGISAXS , by Gauss-Konrod algorithm [35] of the Quadpack package of SLATEC [36] with an autoadaptative sampling of the integration range in order to reach the user desired accuracy.

2.3.2  Orientation and size distributions

When the frame linked to the particle is not aligned with the x- axis of the impinging beam, the rotation matrix has to be applied to the scattering vector in order to apply the previous formulae:
R(z) q = æ
ç
ç
ç
è
cos(z)
sin(z)
0
-sin(z)
cos(z)
0
0
0
1
ö
÷
÷
÷
ø
æ
ç
ç
ç
è
qx
qy
qz
ö
÷
÷
÷
ø
.
(2.43)
The phase factor in qz of Eqs. (2.24-2.34) seems to be useless but it finds all its importance in the averaging process over the size distribution which implies the use of a common frame origin. Indeed, to perform the averages of Eqs. (2.12-2.13), one has to define the distribution probabilities of each parameter which characterizes the particle : lateral size R, width W, height H, orientation z and to compute the integrals:
< |F(q)|2 > = ó
õ


z 
ó
õ


R 
ó
õ


W 
ó
õ


H 
p(z) p(R) p(W) p(H) |F(z,R,W,H,q)|2  dzdR dW dH
| < F(q) > |2 = ê
ê
ó
õ


z 
ó
õ


R 
ó
õ


W 
ó
õ


H 
p(z) p(R) p(W) p(H) F(z,R,W,H,q)  dzdR dW dH ê
ê
2
 
.
(2.44)

2.3.3  The core-shell particle

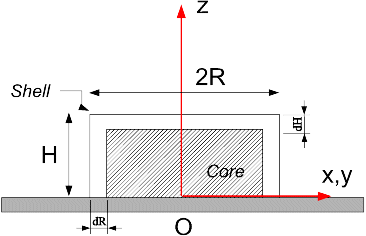
The form factor of a core-shell particle as depicted in Fig. 2.5 is calculated through:
Fcs(q) = Fco + t(Fsh-Fco)     with    t = ì
ï
ï
ï
í
ï
ï
ï
î
1-nsh2

1-nco2
for particles in BA, DWBA
ns2-nsh2

ns2-nco2
for buried particles
ns2-nsh2

ns2-1
for hole in a substrate
(2.45)
where nco,nsh,ns are the index of refraction of the core, the shell and the substrate respectively (see Sect. 2.4). Notice that the encapsulating layer is absent at the bottom of the particle (plane z=0).
figures/chap1/coreshell.gif
Figure 2.5: The core shell particle.

2.4  The form factor within the Distorted Wave Born Approximation

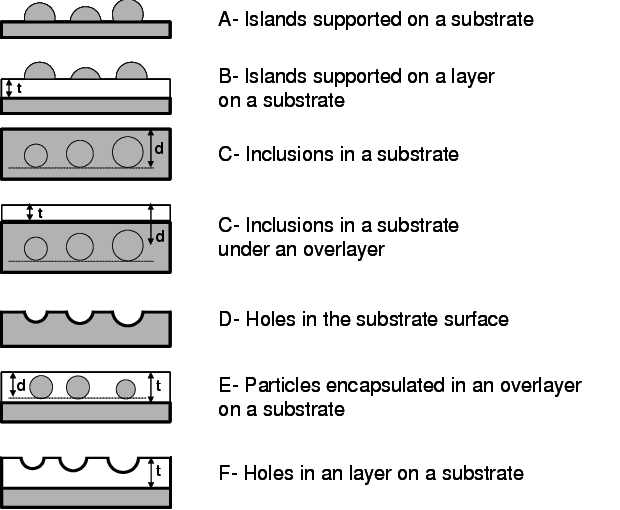
Because of the presence of the substrate and of the closeness of ai from the critical angle of total external reflection ac, the Born Approximation has to be modified in order to account for reflection-refraction effects at the surface of the substrate. The appropriate theory called Distorted Wave Born Approximation is nothing else than the application of first order perturbation [37,10,26] in the scattering process; the trio of incident-reflected-refracted waves at flat interfaces are taken as the unperturbed systems while the perturbation is induced by the particle roughness or contrast variation to the correct unperturbed wave. The following geometries Fig. 2.6 are encompassed in the IsGISAXS program: Notice that the particles are always gathered in one plane which defines the origin of the form factors.
figures/chap1/layer_geome.gif
Figure 2.6: The particle layer geometry developed in IsGISAXS .

2.4.1  Islands on a substrate or on overlayer

Historically, the IsGISAXS program was developed to handle mainly this geometry. A diagrammatic picture of the scattering cross section in the DWBA for an island [27] is depicted on Fig. 2.7. ki and kf are respectively the incident and outgoing wavevectors.
figures/chap1/dwba.gif
Figure 2.7: The four terms involved in the scattering by a supported island. The first term corresponds to the simple Born approximation.
The four terms involved in the scattering process are associated to different scattering events which involve or not a reflection of either the incident beam or the final beam collected on the detector. These waves interfere coherently giving rise to the following effective form factor:
F(q||,kiz,kfz) =
F(q||,kfz-kiz) + RF(ai)F(q||,kfz+kiz) + RF(af)
F(q||,-kfz-kiz) + RF(ai)RF(af) F(q||,-kfz+kiz).
(2.46)
In the previous expression, the classical form factor of an island comes into play but it is evaluated with specific wavevector transfers. Thus in the DWBA, the form factor does not simply depend on the wavevector transfer q but on (q||,kiz,kfz). Each term is weighted by the corresponding reflection coefficient, either in incidence RF(ai) or in reflection RF(af) which are defined through the Fresnel formulae:
RF =
kz-
~
k
 

z 

kz+
~
k
 

z 
    with    
~
k
 

z 
= -
Ö
 

ns2 k02 - |k|||2
 
.
(2.47)
ns = 1 - ds - ibs is the complex refractive index of the substrate. Possibly, the Fresnel reflectivity of the substrate Eq. (2.47) can be reduced, in a classical way [5], by an uncorrelated roughness of mean standard deviation s = Ö{ < h2 > }:
RS = RF exp æ
è
-2 s2 kz
~
k
 

z 
ö
ø
.
(2.48)
Moreover, if the substrate is covered with a continuous layer of thickness D, the reflectivity RS [5] becomes:
RS =
r01 + r12 exp æ
è
2 i
~
k
 
1
z 
D ö
ø

1 + r01 r12exp æ
è
2 i
~
k
 
1
z 
D ö
ø
,
(2.49)
where [k\tilde]zj = - Ö{nj2 k02 - |k|||2} is the perpendicular wave-vector component in medium j and rij = ([k\tilde]zi-[k\tilde]zj)/([k\tilde]zi+[k\tilde]zj); r01,r12 are the reflectivity of the vacuum-layer and layer-substrate interfaces. Thus, the form factor is modulated by the Kiessig fringes of this overlayer.
To conclude, the correct scattering cross section of one island is:
ds

dW
(q) = ê
ê
k02

4pre r0
(1-ni2) F(q||,kiz,kfz) ê
ê
2

 
,
(2.50)
with ni=1-di - ibi the indexes of refraction of the island. If bi=0, as the scattering is connected to the refraction index via di=2pr0 re/k02, the prefactor is equal to one to first order in di.
An effective and approximative way called Effective Layer Born Approximation (ELBA) to account for this phenomenon is to simulate only the strong dependance of the scattered intensity as function of kzf by multiplying the Born term by a transmission coefficient in an effective layer:
F(q||,kiz,kfz) @ F(q||,kfz-kiz)×T(kzf)
T(kzf) = 2kzf

kzf +
~
k
 
f
z 
.
(2.51)
In this last case the index of refraction is that of the effective layer, where the islands are supposed to be buried.
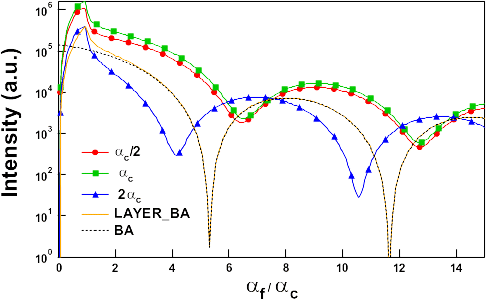
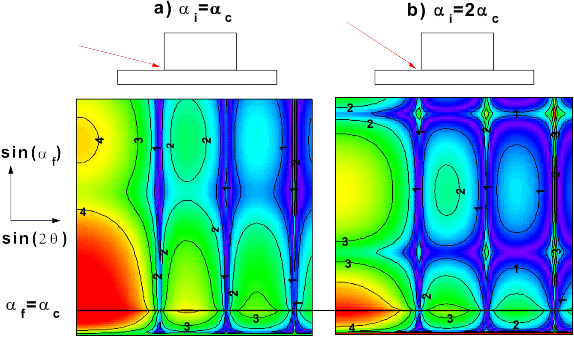
Because of the sharp variation of the reflection coefficient around the critical angle for total external reflection ac=Ö{2d}, the DWBA is expected to be important only when the incident ai or exit af angles are closed to ac. More precisely, the influence of the reflection-refraction effect is depicted in Fig. 2.8.
figures/chap1/dwbacompa.gif
Figure 2.8: The interference fringes for the form factor of a cylinder of height H=5 nm (l = 1 Å-d = 5 10-6,b = 2 10-8) as function of the exit angle af normalized by the angle of total external reflection ac within the various approximations: BA, DWBA(ai=ac/2,ac,2ac), effective layer BA(ai=ac).
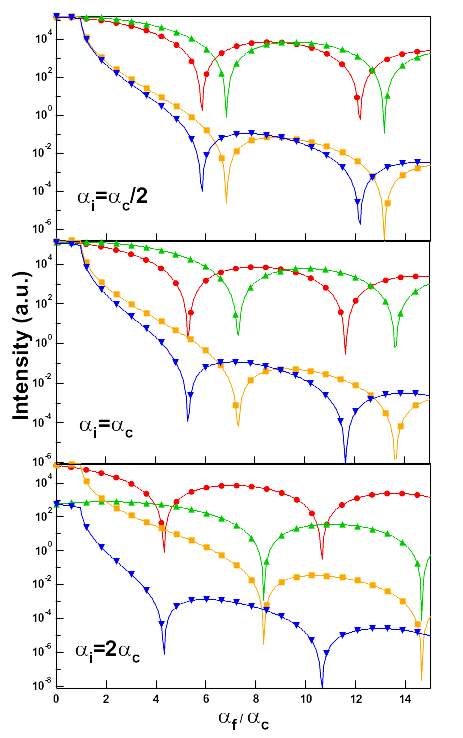
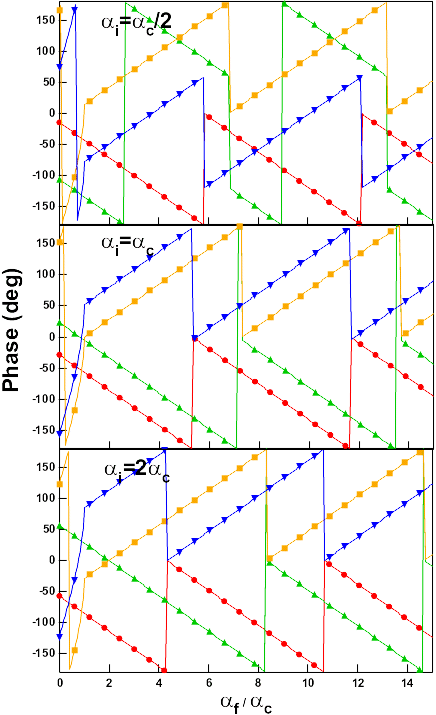
Because of a complex interference between the four terms Fig. 2.8-2.9-2.10, neither the Born Approximation nor the effective layer model are able to catch the exact position of the form factor minima and the overall curve intensity, in particular when ai is closed to ac (maximum of intensity). This interference phenomenon blurs the sharp minima of the cardinal sine function which is found in the simple Born Approximation as the phase factors Fig. 2.10 are shifted from one term to the other by ±kzi. However, if ai > ac and af > ac, the Born Approximation and the effective layer model can give a good approximation as shown in Fig. 2.8. Indeed, in this case the dominant term of the DWBA form factor F(q||,kiz,kfz) is the first one.
figures/chap1/dwbaalphac.gif
Figure 2.9: The modulus square of the four terms Fig. 2.7 for a cylinder as function of af for various ai: Term 1(red)-Term 2(green)-Term 3(orange)-Term 4(blue) (same parameters as in Fig. 2.8).
figures/chap1/dwbaphase.gif
Figure 2.10: The phase of the four terms Fig. 2.7 for a cylinder as function of af for various ai: Term 1(red)-Term 2(green)-Term 3(orange)-Term 4(blue) (same parameters as in Fig. 2.8).

2.4.2  Inclusions in a substrate or under a layer

The scattering cross section for a buried particle was derived by Rauscher [26]:
ds

dW
(q) = ê
ê
k02

4pre r0
(ns2-ni2) F(q) ê
ê
2

 
.
(2.52)
F(q)=T(kzi) T(-kzf)F(q||,[(qz)\tilde]) exp(- i[(qz)\tilde]d ) is the form factor computed with wavevector transfer inside the substrate [(qz)\tilde]=[k\tilde]zf-[k\tilde]zi multiplied by the transmission function in incidence and emergence. The transmission functions are given by Eq. (2.51) and can be modified, like for the reflection coefficient, by an uncorrelated roughness and by the transmission through an overlayer of thickness D. The function T(kzf) gives rise to the Yoneda peak behavior i.e an enhancement of scattered intensity at the critical angle in emergence. This term is often explained on the basis of the reciprocity theorem for light propagation [8]. Moreover, comes into play the phase factor linked to propagation and attenuation of the plane wave during its path to the inclusion layer buried at depth d.

2.4.3  Holes in a substrate

Holes in a substrate can be viewed as particles with a index of refraction equal to that of vacuum with their bottom located on the substrate surface. The scattering cross section is identical to Eq. (2.52) except that ni=1; moreover the hole form factor has to be computed with the right wavevector transfer i.e. -[(qz)\tilde] (as the axis coordinates linked to the hole is defined downwards) and with d=0.

2.4.4  Particles encapsulated in a layer

The scattering cross-section for a particle encapsulated in an layer of thickness D and index of refraction nl on a substrate can be derived within the DWBA approach starting with the well known reflection-refraction of a plane wave on a layer :
ds

dW
(q) = ê
ê
k02

4pre r0
(nl2-1) F(q||,kiz,kfz) ê
ê
2

 
.
(2.53)
As in the case of islands sitting on a substrate, the effective form factor results from the coherent interference between four waves:
F(q||,kiz,kfz)
=
T1(ai) T1(af) exp é
ë
-i (
~
k
 
f
z 
-
~
k
 
i
z 
) d ù
û
F(q||,
~
k
 
f
z 
-
~
k
 
i
z 
)
+
R1(ai) T1(af) exp é
ë
- i (
~
k
 
f
z 
+
~
k
 
i
z 
) d ù
û
F(q||,
~
k
 
f
z 
+
~
k
 
i
z 
)
+
T1(ai) R1(af) exp é
ë
- i (-
~
k
 
f
z 
-
~
k
 
i
z 
) d ù
û
F(q||,-
~
k
 
f
z 
-
~
k
 
i
z 
)
+
R1(ai) R1(af) exp é
ë
- i (-
~
k
 
f
z 
+
~
k
 
i
z 
) d ù
û
F(q||,-
~
k
 
f
z 
+
~
k
 
i
z 
).
(2.54)
R1(ai,f) and T1(ai,f) are the amplitudes of the upwards and downwards propagating waves in the layer 1:
R1(a) =
r12t01exp æ
è
2i
~
k
 
1
z 
D ö
ø

1 + r01 r12exp æ
è
2i
~
k
 
1
z 
D ö
ø
,     T1(a) = t01

1 + r01 r12exp æ
è
2i
~
k
 
1
z 
D ö
ø
(2.55)
tij = 2[k\tilde]zi/([k\tilde]zi+[k\tilde]zj) and rij = ([k\tilde]zi-[k\tilde]zj)/([k\tilde]zi+[k\tilde]zj) are the transmittance and reflectivity of the i-j interface. The denominator in Eq. 2.55 stems for the multireflection of the incident or scattered waves inside the layer of thickness D.

2.4.5  Holes in a layer

Holes in a layer over a substrate can be viewed as particles encapsulated in the layer but with an index of refraction equal to that of vacuum; moreover the bottom of the particle is located on the substrate surface : d=0. The scattering cross section is identical to Eq. (2.53) except that ni=1; moreover the hole form factor has to be computed with the opposite wave-vectors i.e. -[q\tilde]z (as the axis coordinates linked to the hole is defined downwards) and with d=0.

2.4.6  The DWBA on the graded interface

For dense collections of particles (or inversely holes), the propagation of the incident and scattered waves start to feel the profile of refraction index induced by the substrate and the particles themselves. It can be shown [34] that the particle form factor reads:
F(q||,ki z,kf z) = ó
õ
dr|| ei r|| . q|| ó
õ
dz S(r||,z) ì
í
î
~
A
 
-
1 
[ki z,1(z)]
~
A
 
-
1 
[-kf z,1(z)] ei[+kf z,1(z)-ki z,1(z)]z
+
~
A
 
+
1 
[ki z,1(z)]
~
A
 
-
1 
[-kf z,1(z)] ei[+kf z,1(z)+ki z,1(z)]z +
~
A
 
-
1 
[ki z,1(z)]
~
A
 
+
1 
[-kf z,1(z)] ei[-kf z,1(z)-ki z,1(z)]z
+
~
A
 
+
1 
[ki z,1,(z)]
~
A
 
+
1 
[-kf z,1(z)] ei[-kf z,1(z)+ki z,1(z)]z ü
ý
þ
(2.56)
where [A\tilde]1+ and [A\tilde]1- are the amplitudes of the upwards and downwards propagating waves inside the graded interface for the incident or the scattered wavevectors. In other words, the unpertubed states used in the DWBA perturbation formalism read:
Y0(r,k) = ei k||.r|| ì
ï
ï
í
ï
ï
î
~
A
 
+
0 
ei kz,0z + e-i kz,0 z
    for
z > t
~
A
 
+
1 
(z) ei kz,1(z)z +
~
A
 
-
1 
(z) e-i kz,1(z) z
    for
0 < z < t
~
A
 
-
2 
e-i kz,2z
    for
z < 0
(2.57)
where t is the total thickness of the graded interface. As the previous integral is computed numerically, the interface is sliced in N layers, j=1,N in the downwards direction (see Fig. 2.11), starting at the vacuum/layer interface and ending at the substrate. The amplitudes [A\tilde]1+ and [A\tilde]1- are computed recursively from the knowledge of the profile of refraction index [n\tilde]0(z) using an Abelès type formalism [29] of transition matrices:
é
ê
ê
ë
A1,j+
A1,j-
ù
ú
ú
û
= é
ê
ê
ë
pj,j+1 ei(kz,1,j+1-kz,1,j)zj+1
mj,j+1 e-i(kz,1,j+1+kz,1,j)zj+1
mj,j+1 ei(kz,1,j+1+kz,1,j)zj+1
pj,j+1 e-i(kz,1,j+1-kz,1,j)zj+1
ù
ú
ú
û
é
ê
ê
ë
A1,j+1+
A1,j+1-
ù
ú
ú
û
(2.58)
where :
pj,j+1 = kz,1,j+kz,1,j+1

2kz,1,j
,     mj,j+1 = kz,1,j-kz,1,j+1

2kz,1,j
(2.59)
The perpendicular wavevcetor in each slice is given by kz,1,j=-Ö{[n\tilde]0(z)2k02 - k||2}. For further details, see Ref. [34,38]
figures/chap1/gradedslice.gif
Figure 2.11: Schematic drawing of the slicing of graded interface [n\tilde]0(z) used in Eq. 2.56. The formalism is more general that the case of islands depicted here.

2.5  The interference function

In the evaluation of the interference function Eq. (2.14), three main useful cases can be distinguished:

2.5.1  The pair correlation function

When the particles do not present a long range-order, as for instance in a classical nucleation-growth-coalescence process, the only relevant statistical quantity in the interference function is the total pair correlation function, as underlined in the DA and LMA (see Sect. 2.2). Let assume that dP(r||) is the number of particles at r|| knowing that a particle is at the origin. As for a completely random distribution, this value tends towards the surface per particle times the elementary surface area around r||, one defines the pair correlation g(r||) function as the departure from this mean value:
dP(r||) = rS g(r||)d2r||.
(2.60)
with rS the particle density per surface unit. In fact, the autocorrelation function of the particle-particle position can be written in terms of the pair correlation function:
z(r||) = d(r||) +rS g(r||).
(2.61)
The Dirac function represents the particle at the origin. Using Eq. (2.15), one sees that:
g(r||) = 1

S
<
å
i ¹ j 
d(r-ri + rj ) > ,
(2.62)
where < ¼ > is a configuration average. As the long-range order is absent, g(r||) ® 1 when r|| ® ¥. Thus writing Eq. (2.61) in the following way:
z(r||) = d(r||) +rS + rS (g(r||)-1)
(2.63)
lets appear the oscillating part of g(r||). By Fourier transform of Eq. (2.63), one obtains the interference function Eq. (2.14):
S(q||) = 1 + rS d(q||) + rS ó
õ
(g(r||)-1) exp( i r||·q|| )  d2r|| .
(2.64)
The first term leads to the specular rod; it will be ignored in the following as it is often difficult to measure it as the same time as the diffuse scattering because of several orders of intensity magnitude separate them. Furthermore, for an homogeneous and isotropic sample, the pair correlation function and the interference function depend only on the modulus r|| and q||, respectively. Thus in two dimensions:
S(q||) = 1 + 2prS ó
õ
¥

0 
(g(r||)-1) J0( r|| q|| ) r||  dr||.
(2.65)
An inverse Fourier transform leads to the following result:
g(r||) = 1 + 1

2prS
ó
õ
¥

0 
(S(q||)-1) J0( r|| q|| ) q|| dq||.
(2.66)
By building, the limit g(r||)® 1 when r|| ® ¥ insures the convergence of the previous equation. The size of the coherently irradiated area Sc was not accounted for in the previous derivation; it should lead to a convolution product of the right hand side of Eq. (2.64) with the Fourier transform of the autocorrelation function of Sc and to a broadening to the specular rod rS d(q||). To conclude, one has to take care to the fact that, after eliminating the "Dirac peak", the value of the interference function at the origin S(q||=0) is not zero but equal to the relative fluctuations on the number of particles in the irradiated surface [39,40].
Some arbitrary pair correlation functions have been implemented in the program IsGISAXS . Although their shape catch the main features for this type of function as the first neighbor peak, they do not represent a physical situation in all the parameter space as they are not self-convolution products of a function in 2 dimensions. Moreover, the particle density for these functions is not specially linked to the first neighbor distance D as one would expect. By convention, the hard core radius R0 is set to the mean value for the parallel rotational radius of the particle. For instance, for a cylinder R0= < R > , for a parallelepiped R0=Ö2 < R > . In the case of the hard core function pf0,pf1,pf4,HC, the hard core diameter is given by the parameter sigma and thus its value can be different from 2R0.
No special normalization can be applied to these function except for pf3,pf4 where the w parameter can be found through the conservation of the number of particles:
rS ó
õ
¥

0 
2pr (g(r)-1)  dr = 1.
(2.74)
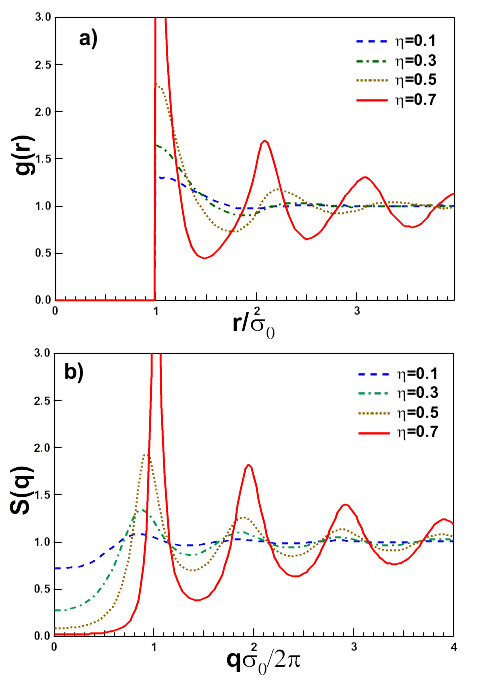
The example of the hard-core pair correlation function and its interference function is given in Fig. 2.12. The main parameter is the effective surface coverage h = rS ps2/4. Obviously, the pair correlation function is equal to zero for r < s. Its shape is close of the Debye behavior (pf0 or pf4) for the small coverage whereas for higher coverage the function is more and more structured with peaks in the interference function at values close to multiples of 2p/s. Notice that in this case, the maximum in g(r) is found at s, independently of the particle density.
figures/chap1/HC.gif
Figure 2.12: The hard-core pair correlation function a) and the interference function b) as function of the surface coverage h = rS ps2/4, with s the hard core diameter. The functions are plotted against reduced parameters r/s and qs/2p.

2.5.2  The regular bidimensional lattice

In the case of a regular lattice, a pattern is linked to each node of the lattice defined by its basis vectors a,b; a0 is defined as the angle between a and b. The interference function Eq. (2.14) shows that the intensity is concentrated in Bragg rods perpendicular to the substrate surface. For infinite crystal, these rods are Dirac peaks at the nodes of the reciprocal lattice given by the vectors a*,b*:
a* = 2p bÙn

a ·[ bÙn ]
,     b* = 2p nÙa

b ·[ nÙa ]
,
(2.75)
with n is the normal to the surface and Ù the vectorial product.
In order to calculated the interference function, the orientation xi of the first lattice vector a with respect to the x- axis implies to rotate the wavevector transfer as:
R(xi) q = æ
ç
ç
ç
è
cos(xi)
sin(xi)
0
-sin(xi)
cos(xi)
0
0
0
1
ö
÷
÷
÷
ø
æ
ç
ç
ç
è
qx
qy
qz
ö
÷
÷
÷
ø
(2.76)
before its decomposition on the basis vectors a,b. Moreover, in the case of a regular lattice made of different variants rotated (xi angle) from one to the other, an incoherent sum of intensities has to be applied with the weights of each variant.

Defective crystal: finite size effect

In reality, the crystal is always defective and the first defect that is encountered is the finite size : Na,Nb cells in both direction a,b. Thus, by decomposing q on the a*,b* basis (q = aa* + bb*), the interference function is equal to:
SL(q)
=
1

NL
ê
ê

å
i 
exp(i q·Ri||) ê
ê
2
 
=
1

Na Nb
ê
ê
Na-1
å
n=0 
Nb-1
å
m=0 
exp[i (aa* + bb*) ·(na + mb)] ê
ê
2
 
=
1

Na Nb
ê
ê
Na-1
å
n=0 
exp(i 2 pan) ê
ê
2
 
ê
ê
Nb-1
å
m=0 
exp(i 2pbm) ê
ê
2
 
=
1

Na
ê
ê
sin(paNa)

sin(pa)
ê
ê
2

 
1

Nb
ê
ê
sin(pbNb)

sin(pb)
ê
ê
2

 
.
(2.77)
In the case of various types of domain sizes, one has to make an incoherent sum of the diffracted intensities from the various domains as in the case of variants.

Defective crystal: correlation length

To account for various kinds of defects in diffraction, it is usual to asses that the correlation between two unit cells decreases with their distance in such a way that:
SL(q) = 1

Na Nb

å
i 

å
j 
exp[iq·(Ri||-Rj||) ] C(Ri||- Rj|| ).
(2.78)
with : C( Ri||- Rj|| ) ® 0 when | Ri||- Rj|| | ® ¥. However when the correlation function depends only on the distance between nodes, the summation in Eq. (2.78) has no analytical simple expression and is untractable numerically. One approximate and tractable way consists in writing:
C( Ri||- Rj|| ) = C( (ni-nj) a + (mi-mj)b )
= exp æ
è
- 2 pa|ni-nj|

La
ö
ø
exp æ
è
- 2 pb|mi-mj|

Lb
ö
ø
.
(2.79)
With these expressions knowing that q = aa* + bb*, one finds for a size limited lattice:
SL(q) = 1

NaNb
Sa(q) Sb(q)
(2.80)
with:
Sa(q) = Na-1
å
ni,nj=0 
exp( i 2pa(ni-nj) ) exp æ
è
- 2 p|ni-nj|a

La
ö
ø
Sb(q) = Nb-1
å
mi,mj=0 
exp( i 2pb(mi-mj) ) exp æ
è
- 2 p|mi-mj|a

Lb
ö
ø
.
(2.81)
The summation can be carried out and leads to:
Sa(q)

Na
= Real é
ë
1 - 2

1-exp[ 2 p(a/La -i a)]
+ 2

Na
× 1 - (exp[ 2 p(-a/La - i a)] )Na

2 - exp[ 2 p(a/La + ia) ] - exp[2 p(-a/La - i a) ]
ù
û
.
(2.82)
and the same expressions for Sb(q). For a Gaussian dependence in C( Ri||- Rj|| ), the sum is untractable analytically but converges rapidly on a numerical point of view.

Defective crystal: reciprocal space approach

The other way is to work directly in the reciprocal space by convoluting the nodes of the reciprocal lattice with special shapes (Gaussian, Lorentzian, ...) as it is done, in a similar way, in the case of the analysis of powder diffraction data:
SL(q) =
å
n 

å
m 
S(q-n a* - m b*),
(2.83)
with S is the desired shape for the diffraction rod.
As a matter of convenience in IsGISAXS , the peak shape has been defined in three ways:

The unit cell structure factor and the Decoupling Approximation

In the case of a regular lattice, a pattern which is made of Ni particles is attached to each node of the lattice. By using the hypothesis of a full decorrelation between the position of the unit cell and its contents , the form factor in Eqs. (2.12-2.14,2.46) has to be replaced by the structure factor of the unit cell which describes its content:
FS(q) =
å
k 
Fk(q) exp(i q||·r||k ),
(2.98)
where r||k = xk a + yk b is the position of the kth particle in the unit cell. Moreover, the mean values in Eqs. (2.12-2.13) should account for the intra-cell position and for the scatterer type disorders. With a lack of intra-cell correlation for these parameters, one is led to:
< FS(q) > = <
å
k 
< Fk(q) > K exp(i q||·r||k ) > P.
(2.99)
with the indexes K,P stand for kind and position. It is possible to write r||k = r||k,0 + dr||k as the sum of its mean value and a deviation from it; after an expansion of the exponential term with < dr||k > =0, the classical Debye-Waller term appears:
< FS(q) > =
å
k 
< Fk(q) > K exp(i q||·r||k,0 ) exp æ
è
- Wk

2
ö
ø
,
(2.100)
with Wk = < ( q||·dr||k )2 > P = q|| Bk q||.
Bk is the symmetric tensor of standard deviations of the kth particle position. In an analogous way,
< | FS(q) |2 > =

å
k 
< |Fk(q)|2 > K +
å
k ¹ l 
< Fk(q) Fl*(q) > K
exp(i q||·(r||k,0 - r||l,0 ) ) é
ë
exp æ
è
- Wk

2
ö
ø
+ exp æ
è
- Wl

2
ö
ø
- 1 ù
û
.
(2.101)
By gathering Eqs. (2.100-2.101) in Eqs. (2.12-2.13), one ends up to first order in the disorder Debye-Waller factors with:
ds

dW
(q) @ Id(q) + Ic(q)
(2.102)
Id(q) = 1

Ni

å
k 
{ < |Fk(q)|2 > K - | < Fk(q) > K |2 exp(-Wk) }
(2.103)
Ic(q) = SF(q) SL(q)
(2.104)
SF(q) = 1

Ni
ê
ê

å
k 
< Fk(q) > K exp(iq||·r||k,0 )exp æ
è
- Wk

2
ö
ø
ê
ê
2

 
.
(2.105)
It appears that the decrease of intensity in the coherent part Ic(q) of the intensity induced by the Debye-Waller factor is found in the diffuse scattering Id(q) spread uniformly over all the reciprocal space in the total decoupling approximation.

The unit call structure factor and the Local Monodisperse Approximation

In this approximation, the diffuse scattering is forgotten and each node is decorated with a structure factor accounting for the Debye-Waller term but with each particle replaced by its mean value over size and shape distributions:
ds

dW
(q) @ SF(q) SL(q)     with     SF(q) = 1

Ni
ê
ê

å
k 

Ö
 

< |Fk(q)|2 > K
 
exp(i q||·r||k,0 )exp æ
è
- Wk

2
ö
ø
ê
ê
2

 
.
(2.106)

2.5.3  The bidimensional ideal paracrystal

Theory

The paracrystal theory is fully described in the book of Hosemann [40]. The type of disorder (called of first kind) described previously in the interference function of a regular lattice SL(q) does not affect the long range order but only the intensity in the Bragg peaks. On the contrary, in the paracrystal model, the long-range order is destroyed gradually in a probabilistic way. This model allows to make the link between the regular lattice and fully disordered structures.
To understand it, the example of the one-dimensional disordered lattice [39] is instructive. To build the autocorrelation function g(x) of the particle positions, the distance between two successive points An-1,An is chosen to be independent of the previous and next one and to obey a statistical distribution p(x) with:
ó
õ
¥

-¥ 
p(x) dx = 1
ó
õ
¥

-¥ 
x p(x) dx = D.
(2.107)
Thus, after having put the first particle at the origin A0 and second particle A1 at a distance x from the first one (see Fig. 2.14) with a probability density p1(x)=p(x), the probability of putting the third one A2 at a distance y from the first one is given by the occurrence of a distance x between the first and the second one and a distance y-x between the second and the third.
figures/chap1/1DDL2.gif
Figure 2.14: The schematic view of the one dimensional paracrystal.
By integrating over all the x possible values, one is led to:
p2(x) = ó
õ
+¥

-¥ 
p(y)p(x-y) dy
(2.108)
which is the self convolution product p(x) Äp(x). By generalizing,
g+(x) = d(x) + p(x) + p(x) Äp(x) + p(x) Äp(x) Äp(x) + ¼
(2.109)
After the addition of the negative axis contribution, the interference function is then given by the Fourier transform of Eq. (2.109):
S(q) = 1 + P(q) + P(q) ·P(q) + P(q) ·P(q) ·P(q) ¼
(2.110)
By writing the Fourier transform of p(x) as P(q) = fexp(i u), one finds:
S(q) = 1 + 2 ¥
å
n=0 
fn cos( n u) = 1 - f2

1 + f2 - 2 fcos(u)
.
(2.111)
For a gaussian probability density,
p(x) = 1

w
Ö

2 p
exp é
ë
- (x-D)2

2 w2
ù
û
P(q) = exp( pq2 w2 ) exp(i q D ).
(2.112)
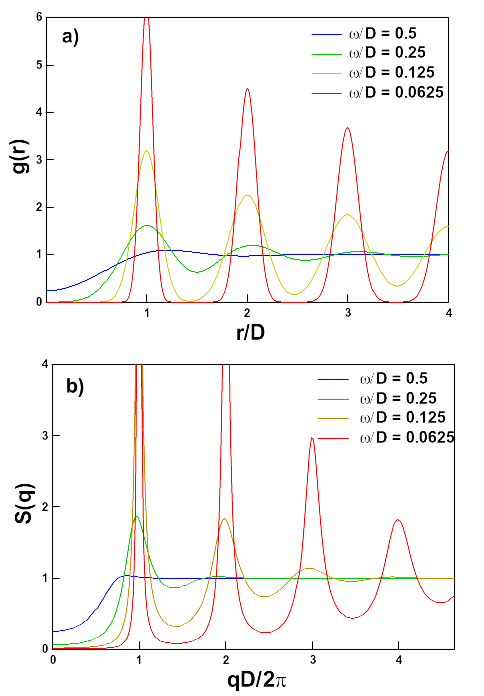
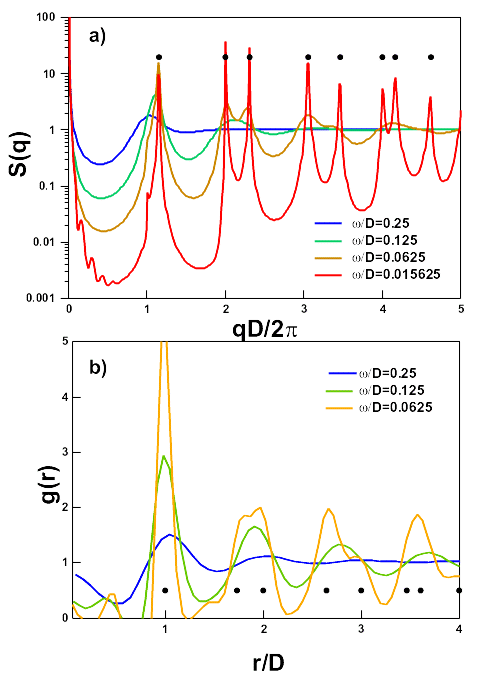
The results for this gaussian disorder are depicted in Fig. 2.15 in direct and reciprocal space. The broadening of the peaks with increasing the ratio w/D shows the transition from an ordered lattice to a disordered lattice.
figures/chap1/1DDL.gif
Figure 2.15: The pair correlation function a) and the interference function b) in the case of the 1D paracrystal for various disorder parameter w/D.
In two dimensions, the paracrystal is built on a pseudo regular underlying lattice with basis vector a,b (see Fig. 2.16). In IsGISAXS , only the case of perfect or ideal paracrystal i.e. with parallelogram cell is implemented.
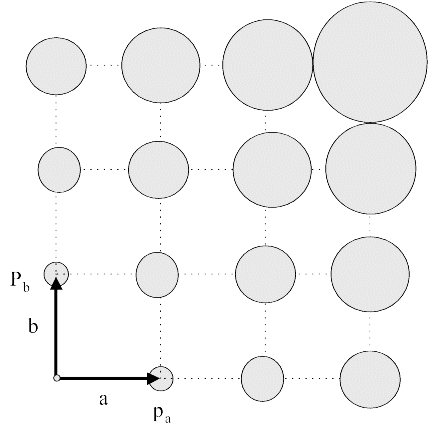
figures/chap1/2DDL.gif
Figure 2.16: The schematic view of a paracrystal in two dimensions. Each circle represents the area where the probability of finding one particle is maximum.
In an analogous way as for 1D, the probability of finding a particle at a position around the basis vector a,b are defined by pa(r),pb(r), respectively with:
ó
õ
pa,b(r)  d2r = 1,   ó
õ
r pa(r)  d2r = a,   ó
õ
r pb(r)  d2r = b.
(2.113)
If the Fourier transform of probability densities are defined by Pa,b(q||), assuming that all the directions behave independently, the interference function appears as:
SL¥(q||) =
Õ
k=a,b 
Real æ
è
1+Pk(q||)

1-Pk(q||)
ö
ø
.
(2.114)
However, with this formalism, a divergence appears close to the origin of the reciprocal space when one approaches along a direction perpendicular to one basis vector. This divergence is cured by the convolution brought by the finite sizes of the coherent domains [40,45,46,47]. On a practical point of view, the finite size of the paracrystal is incorporated, not by the shape function of the crystal, but by explicitly accounting for the number of cells Nk in the k direction:
SL(q||) =
Õ
k=a,b 
Real æ
è
2 1-Pk(q||)Nk

1-Pk(q||)
-1 ö
ø
.
(2.115)
Notice that Eq. (2.115) contains the "Dirac peak" at q=0 of Eq. (2.64) (term in Pk(q||)Nk). Finite size effects can also be introduced in an effective way through a correlation length L0 in the 1D-paracrystal interference function upon replacing P(q) = fexp(i q D) by P(q) = fexp(i q D) exp(-D/L0). L0 broadens in a lorentzian way the Dirac peak at q=0 (see Eq. 2.64).

The probability densities

As a matter of convenience, the Fourier transforms of the probability densities Pa,b are defined in the program IsGISAXS in three ways (like for the regular lattice rod shape Sect. 2.5.2):
figures/chap1/2DDL_geome.gif
Figure 2.17: Sketch of 2D paracrystal probability ellipsoids orientation.

Isotropic interference functions built on an ideal paracrystal

One convenient way of getting a "physical" isotropic interference function is to average the paracrystal interference function Eq. (2.115) over all the azimuthal directions xi.
figures/chap1/2DDLSqgr.gif
Figure 2.18: The interference function a) and the pair correlation function b) for a paracrystal of hexagonal symmetry averaged over all the azimuths xi. The gaussian disorder parameter w/D is indicated on figure. The axis are normalized by the lattice parameter D and the expected peaks position 1,Ö3,2,Ö7,3,2Ö3,Ö{13},4 are marked with a circle.
Fig. 2.18 presents the S(q||) function and the corresponding g(r||) for an hexagonal paracrystal of parameter D with various gaussian isotropic disorder w/D. The peak at q||=0 is, as explained above, the result of the Fourier transform of the crystal shape function whose oscillatory parts appear clearly at small disorder. The back Fourier transform Eq. (2.66) for computing g(r||) leads to unphysical results below r||/D=1. Besides this problem, by reducing w/D, the interdistances in the hexagonal lattice 1,Ö3,2,Ö7,3,2Ö3,Ö{13},4 (in reduced units) shows up more and more clearly in the g(r||) function. It is very instructive to notice that, depending on the disorder value, the first peak in the interference function is shifted from the expected value q||=2p/D. This shift is simply linked to the modulus of the first reciprocal basis vector which is 2/Ö3 @ 1.15. Thus, as the close packing in 2D leads to a deformed local hexagonal symmetry, taking rS = (qm/2p)2 as the particle density (qm position of the interference peak) induces an overestimation of 15%. This error often encountered in the literature is induced by an hidden square lattice hypothesis.

2.6  The reflectivity from a layer of particles

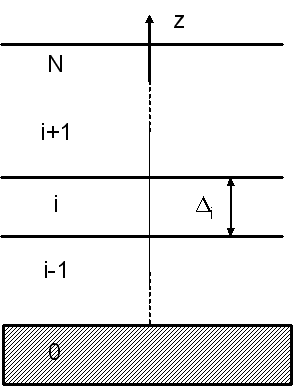
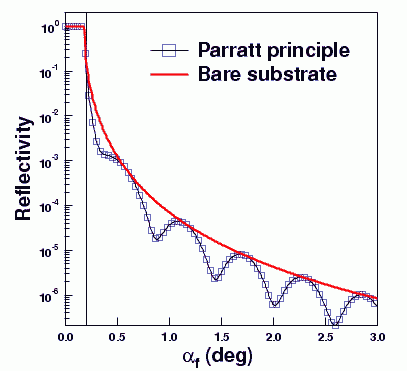
The layer reflectivity RN (proportional to the GISAXS specularly reflected beam [10]) can be computed recursively through the Parratt principle [48]. The profile of index of refraction is sampled over a finite number of layers. Other layers as in the case of a substrate covered by a thin film can be added to such a stacking. The reflectivity of a stacking of i-layer (see Fig. 2.19) is obtained as function of the the reflectivity of the stacking of (i-1)-layer:
Ri+1,i =
ri+1,i + Ri,i-1 exp æ
è
2i
~
k
 
i
z 
Di ö
ø

1 + ri+1,iRi,i-1 exp æ
è
2i
~
k
 
i
z 
Di ö
ø
(2.129)
where
ri+1,i =
~
k
 
i+1
z 
-
~
k
 
i
z 

~
k
 
i+1
z 
+
~
k
 
i
z 
(2.130)
is the reflectivity of the (i+1,i)-interface. The reflectivity of the whole stack RN is evaluated starting from the reflectivity of the substrate R1,0 = r1,0. The computed reflectivity is all the more accurate than the number of layers used to sample the profile of density is important.
figures/chap1/parratt.gif
Figure 2.19: The stacking of N-layers along the normal to the substrate is used to compute the reflectivity from the Parratt recursive principle.


Chapter 3
How to use the IsGISAXS software ?

The program IsGISAXS runs under Windows 9x,2000,XP,NT operating systems in a windows mode. The development language is Fortran 90 under Intel Visual Fortran [49]. The graphical library is PGPLOT [50].

3.1  The IsGISAXS software environment and outputs

The philosophy of the program IsGISAXS is to use special input files (i) for the simulation of GISAXS images or cross sections or (ii) for the fit of experimental data. These files are named *.inp, *.fit and *.mor will be described in the following sections. On starting, the program reads automatically some information files *.inf located in the IsGISAXS.exe/inf directory. The file gisaxs.inf contains: The other file graph.inf contains a set of parameters for the graphical outputs that are set-up with windows based dialog boxes. The file grfont.dat from PGPLOT library is used for displaying the graphical outputs.
The menu bar is made of the following items and sub items: The short keys for the menus are accessible by Alt-Key. The simulation, pre-fit and fit can be launched by pressing the F5,F6,F7,F8 keys, respectively in the active windows. The F12 key stops the process and the F1 key calls the help manual.
In general, one loads the name of the main files *.inp,*.fit,*.dat,*.mor, launches a simulation or a fit and then visualizes the results of the calculation. The *.inp,*.fit,*.dat file are read at each calculation allowing the user to modify them between two runs without reloading their names.

3.2  Description of the input file *.inp and the underlying parameters

3.2.1  The file contents

An example of the main input file named *.inp is reproduced in Fig. 3.3. Be careful : the format is rather strict for a correct reading !
###########################################
#GISAXS SIMULATIONS : INPUT PARAMETERS
###########################################
# Base filename
results
### Framework and Beam parameters
# Framework,Diffuse,Multilayer Number of slices, Polarization
DWBA LMA 0 50 ss
# Beam Wavelength :Lambda(nm),Wl_distribution,Sigma_Wl/Wl,Wl_min(nm),Wl_max(nm),nWl, xWl
0.1 none 0.2 0.08 0.12 10 -2
# Beam Alpha_i :Alpha_i(nm),Ai_distribution,Sigma_Ai/Ai,Ai_min(nm),Ai_max(nm),nAi, xAi
0.2 none 0.05 0.1 0.3 10 -2
# Beam 2Theta_i :2Theta_i(nm),Ti_distribution,Sigma_Ti/Ti,Ti_min(nm),Ti_max(nm),nTi, xTi
0. none 0.05 -0.1 0.1 10 -2
# Substrate :n-delta_S, n-beta_S, Layer thickness(nm), n-delta_L, n-beta_L, RMS(nm)
6.11642E-06 3.46012E-080. 6.11642E-06 3.46012E-08 0
# Particle : n-delta_I, n-beta_I, Depth(nm),n-delta_SH,n-beta_SH
1.23632E-05 5.34090E-07 0 8.11642E-065.46012E-08
### Grid Parameters ###
# Ewald mode
T
# Output angle(deg) :TwoTheta min-max(deg),Alphaf min-max(deg),n(1),n(2)
0  1.5 0  1.550 50
# Output q(nm-1) :Qx min-max,Qy min-max,Qz min-max n(1) n(2) n(3)
-1  1 -1  1-1  0 100 100 1
### Particle parameters ###
# Number of particle types
1
# Particle type,Probability
cylinder 1
# Fixed parameters :Base angle(deg),Height ratio,Flattening,FS-radii/R
54.7356 1. 1.2 0.8  0.8
# Shell thicknesses (nm)dR, dH, dW
0 0 0
# H_uncoupledW_uncoupled
T T
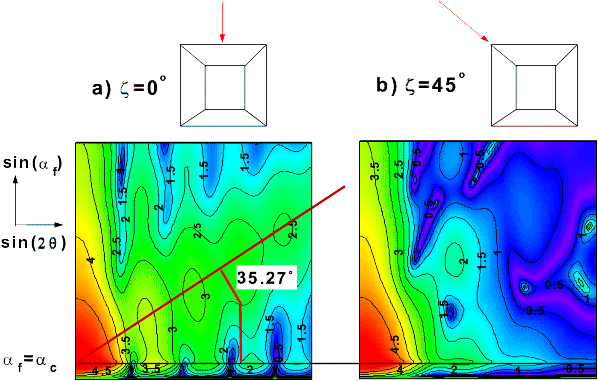
# Size of particle : Radius(nm),R_distribution,SigmaR/R,Rmin(nm),Rmax(nm),nR, xR
6. gaussian 0.5 0.5 10 20 -2
# Height aspect ratio : Height/R,H_distribution,SigmaH/H,Hmin/R,Hmax/R,nH, xH rho_H
0.3 none 0.2 0.25 1. 10 -2 0
# Width aspect ratio : Width/R,W_distribution,SigmaW/W,Wmin/R,Wmax/R,nW, xW rho_W
0.3 none 0.2 0.25 1. 10 -2 0
# Orientation of particle :Zeta(deg),Z_distribution,SigmaZ(deg),Zmin(deg),Zmax(deg),nZ,xZ
0. none 20. -45. 45. 10 -2
### Lattice parameters ###
# Particle distribution types
1DDL
# Interference function : Peak position D(nm),w(nm), Statistics, Eta_VoigtSSCA param, Cut-off
20. 6. gau 0.5 3 1000
# Pair correlation : Density(nm-2), D1(nm)Sigma(nm)
0.016 25. 20
# Lattice parameters : L(1)(nm),L(2)(nm),Angle(deg)Xi_fixed
7.7 17. 90. F
Xi(deg),Xi_distribution,SigmaXi(deg),Ximin(deg),Ximax(deg),nXi, xXi
88. none 120. -120. 120. 3 -2
Domain sizes DL(nm),DL_distribution,SigmaDL/DL,DLmin(nm),DLmax(nm),nDL, xDl
4000  4000none 0.2 0.2 200 200400 40010 10--2
# Imperfect lattice: Rod description,Rod shape
rec_prod_ca cau  cau
Correlation lengths (nm),Rod orientation(deg)
400  400 0  90
# Paracrystal : Probability description
prod_pa
Disorder factors w/L DL-distribution Rod orientation (deg)
0.05  0.05  0.05  0.05
gau  gau  gau  gau
0  90  0  90
# Pattern : Regular pattern content Particles per pattern
F 2
Positions xp/L,Debye-Waller factors
0.  0. 0. 0.  0.
0.4  0.5 0.  0.  0.
Figure 3.3: A typical input file *.inp
All the parameters are necessary for a correct reading although not all of them are used for the calculation. This file is read each time the Run button is activated allowing the modification of parameters between each run.
As introduced in the theoretical chapter Chap. 2, the following options are available :

3.2.2  Some useful remarks

The angle grid for the image calculation is set up in such a way that the scale in x-y is proportional to the sine of the scattering angle as on a 2D-detector. Thus the number of points may be different than the required number of points n(1),n(2).
The available probability densities p(x) for the wavelength l, the incidence angle ai, the particle radius R, aspect ratio H/R or W/R, orientation angle z and for the lattice dimensions DL and orientation angle xi are the following: The probability densities are sampled on N-points through an arithmetic progression:
xi = x1 + i × xmax-xmin

N-1
.
(3.8)
As the number of sampling points N is finite, the normalization of the probability density is numerically ensured by the condition:
A N
å
i=1 
p(xi) = 1 Þ p(xi) ® p(xi)/A.
(3.9)
The boundaries xmin,xmax are defined in two ways depending on the sign of xX value called width multiplier (with X=Wl,Ai,Ti,Z,R,H,Xi,DL). If xX is negative, the value of xmin,xmax in the input file *.inp are used. If positive, these limits are reset accordingly to the central value x0 and to the full width at half maximum of the distribution which depends on the s parameter:
The reflectivity of the particle layer is obtained as a by-product when a simulation with n1=1,2 Theta max=0 is launched. A new column appears then in the *.out file.
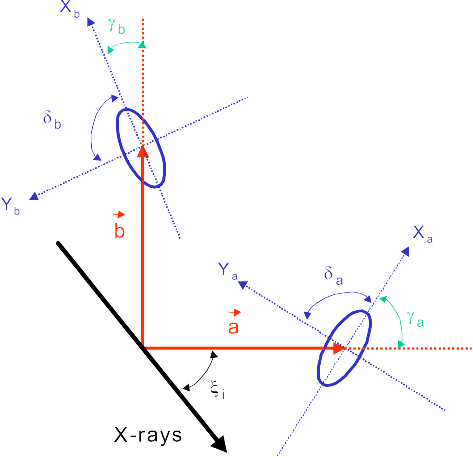
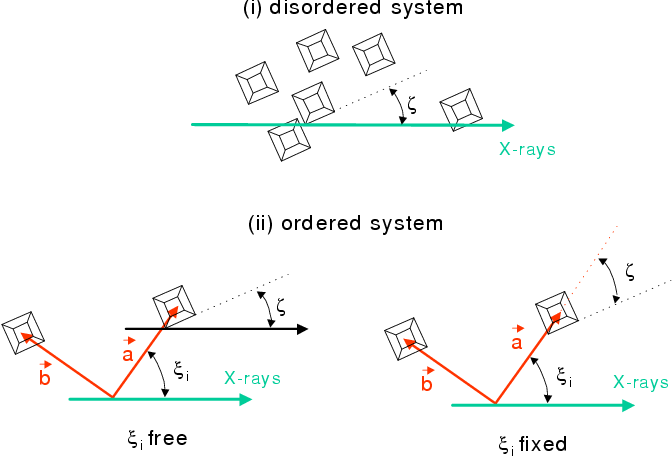
The option Xi_fixed used for setting the orientation of the particles with respect to the X-ray beam or the lattice is sketched in the Fig. 3.4.
figures/chap2/xifixed_geome.gif
Figure 3.4: Relative orientation of the particles with respect to the beam or the lattice.

3.3  The morphology file *.mor

The morphology file *.mor is only used for simulation and contains all the parameters described in the *.inp file. It allows the mixture of any types of particle shapes with any types of morphological parameters. For each class of particles, the user gives the associated probability of occurrence. After reading, the positions of the particles are recalculated from the center of the box containing all the particles.
##############################################
#
# GISAXS SIMULATIONS : MORPHOLOGY PARAMETERS
#
##############################################
# Total number of particles # Cut-off radius (nm)
2 20
# Probability-Particle type-Positions(nm)-Orientation(deg)-Radius(nm)-Height/R-Base angle(deg)-Height ratio-FS-radii/R
0.5 pyramid 0     0 0 2 1 54.7356 0 0     0
0.5 cylinder 5     5 0 2 1 54.7356 0 0     0
Figure 3.5: A typical morphology file *.mor
The reading of such a file is activated by putting Number of different particle type=0 and Particle type=file.
The GISAXS intensity is calculated in the following way:
ds

dW
(q) @ Id(q) + | < F(q) > |2 ×S(q)
Id(q) =
å
m 
< ( Fi(q) - < F(q) > ) (Fi+m(q) - < F(q) > ) > i exp(-i q|| ·Rm,|| ).
(3.11)
The summation in the diffuse scattering Id(q) is calculated up to a cut-off radius Rc of separation between the particles. This radius is given in the in.mor file. The interference function is calculated either in a direct way (morif option in the choice of interference function):
S(q) = 1

N
ê
ê
N
å
i=1 
exp(i q|| ·Ri,|| ) ê
ê
2
 
.
(3.12)
or using the other available functions. If calculated from experimental positions, the interference function is filtered by multiplying the box enclosing all the particles by a Hann function.

3.4  The treatment of experimental data *.dat and the fit file *.fit

The experimental data need to be processed before being used by IsGISAXS . The main treatment is to find the origin of reciprocal space i.e. the intersection of the detection plane and the x-axis. In principle, it should be in between the transmitted and the reflected beam. The a = 0 line correspond to a zero intensity as shown by the DWBA formula whereas the 2q = 0 line is just in the middle of the two symmetric interference peaks or along the reflected beam. Once localized and as the sample-detector distance is known, this origin allows to extract some cross sections I=f(sin(a),sin(2q)) which are the main inputs for the fit process.

3.4.1  The *.fit file

An example of *.fit file is shown on Fig. 3.6.
###########################################
# GISAXS FIT : INPUT PARAMETERS
###########################################
# Cross section :Number of cross sections,# points,Fit type,Error Bar,Epsilon,
2 50 0 1 0.1
# Scale and shift factors :A LA S LS
6e5 T 0. F
0     00     0
F   FF   F
# Reciprocal space origin : St(deg) LSt Sa(deg) LSa
0 T 0. F
0     00     0
F   FF   F
### Framework and Beam parameters
# Beam Wavelength :Lambda (nm),Sig_Wl
F F
0     00     0
F   FF   F
# Beam Alpha_i :Alpha_i,Sig_Ai,2Theta_i,Sig_Ti
F F FF
0     00     00     0 0     0
F   FF   FF   F F   F
# Substrate :n_delta_S,n_beta_S,Thickness(nm)n_delta_L,n_beta_L, Roughness(nm)
F F F F F F
0     00     00     0 0     0 0     0 0     0
F   FF   FF   F F   F F   F F   F
# Particle : n-delta_I, n-beta_I, Depth,n-delta_SH n-beta_SH,
F F F FF
0     00     00     0 0     0 0     0
F   FF   FF   FF   FF   F
### Particle parameters ###
# Probability of particle type
F
0     1
F   F
# Fixed geometrical parameters :Base angle,Height ratio,Flattening,FS-radii/R
F F F F F
0     00     00     00     0 0     0
F   FF   FF   FF   FF   F
# Shell thicknesses :dR,dH, dW
F F F
0     00     00     0
F   FF   F F   F
# Size of particle :Radius(nm),SigmaR/R
T F
0     00     0
F   FF   F
# Height aspect ratio : Height/R,SigmaH/H
T F
0     00     0
F   FF   F
# Width aspect ratio : Width/R,SigmaW/W
T F
0     00     0
F   FF   F
# Orientation of particle :Zeta(deg),SigmaZ(deg)
F F
0     00     0
F   FF   F
### Lattice parameters ###
# Interference function :Peak position D,w, Eta_Voigt CutoOff
F F F
0     00     00     00     0
F   FF   F F   FF   F
# Pair correlation function:Density(nm-2), D1, Sigma(nm)
F F F
0     00     00     0
F   FF   F F   F
# Lattice parameters :L(1)(nm),L(2)(nm),Angle(deg)
F F F
0     00     00     0
F   FF   F F   F
Xi(deg),sigmaXi(deg)
F F
0     00     0
F   FF   F
Domain sizes DL(nm),SigmaDL/DL
F F F F
0     00     00     00     0
F   FF   F F   FF   F
# Imperfect lattice :Correlation lengths (nm),Rod orientation(deg)
F F F F
0     00     00     00     0
F   FF   F F   FF   F
# Paracrystal : Disorder factors w/L,Rod orientation(deg)
F F F F
0     00     00     00     0
F   FF   F F   FF   F
F F F F
0     00     00     00     0
F   FF   F F   FF   F
# Pattern : Positions xp/L,Debye-Waller factors
F F F F F
0     0 0     00     0 0     0 0     0
F   FF   F F   FF   FF   F
F F F F F
0     0 0     00     0 0     0 0     0
F   FF   F F   FF   FF   F
Figure 3.6: A typical input file *.fit for data fitting
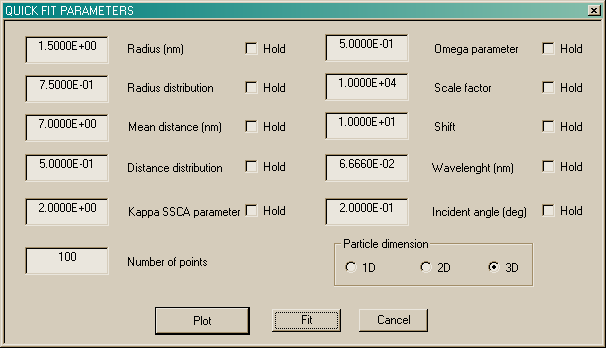
This file has more or less the same structure as the *.inp file except that it gives the constraints for the fitted parameters. T ~ .true. means that the corresponding parameter will be fitted whereas a kept fixed parameter is marked by F ~ .false.. Be careful to fit only the necessary parameters as fitting parameters that do not influence the final result will lead to a singular matrix error or erroneous results.
Hard limits for all the parameters have been implemented in the fitting routine; this means that each parameter x is fixed between two hard bounds xmin, xmax. When in the fit process the parameter reach the bound xmin or xmax, it is stuck at this value. The bounds values are given below the parameter constraint and they are activated or not depending on the value T or F of the logical below. The fit constraints have to be introduced for each particle type as a new set of lines.
The probability of particle kind can be fitted except that at each cycle the constraint on the probability sum (equal to one) is applied on the last particle type in such a way that this parameter is not fitted for this particle.
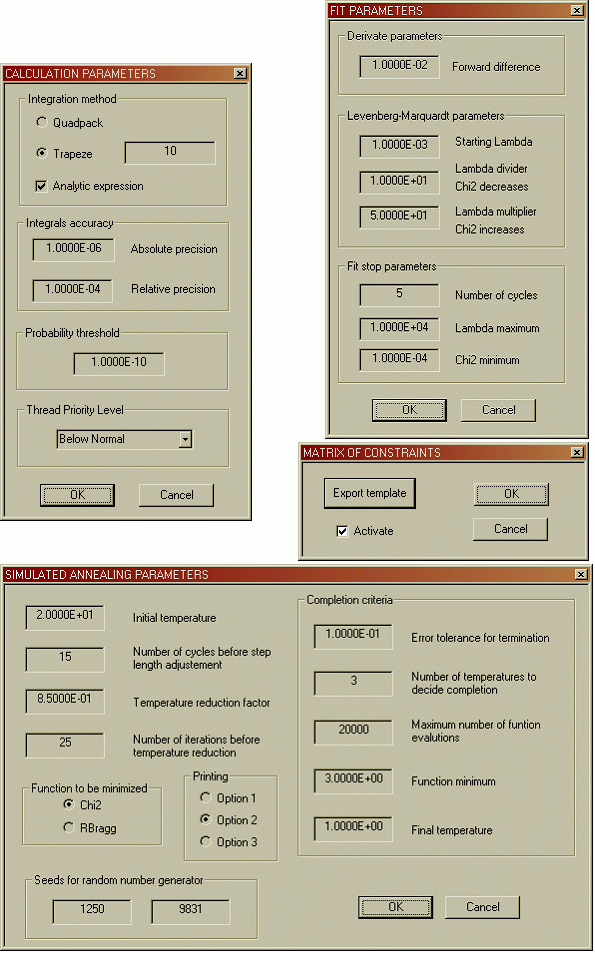
It is possible to fit simultaneously an arbitrary number of cross sections by the minimizing the c2 with the Levenberg-Marquardt algorithm [51] or by simulated annealing [36] using the Corana algorithm. c2 is defined by:
c2
=
n
å
k=1 
 c2k
c2k
=
1

d
  N
å
ik=1 
 wk2   (Icalck,ik-Iobsk,ik)2

(sk,ikobs)2
,
(3.13)
where:
  • n is the number of cross sections,
  • wk is the weight of each cross section,
  • N is the number of points in the cross section,
  • d = n N - f is the number of degree of freedom (f is the number of fitted parameters),
  • Icalck,ik and Iobsk,ik are respectively the calculated and observed intensities at point ik of cross section k,
  • sk,ikobs is the experimental standard error for the point (k,ik).
The following items are accessible in the *.fit file
  • Number of cross sections : n
  • Number of points per cross section : N; the data are interpolated regularly on N points along qy,qz or q=Ö{qy2+qz2} if the cross section is made at constant af,2q or in an arbitrary direction in the (af,2q) plane.
  • Fit type : in order to give different weights on different parts of the curve (in particular when several decades of intensity are involved), the c2 can be defined through a function f(I) of the calculated and experimental intensities. The options are 0:I, 1:ÖI, 2:3Ö{I}, , 3 : lnI.
  • Error Bar : a code for the type of error bars (0: error bars in the *.dat file, 1: s = Ö{f(I)+ (ef(I))2} , 2: s = 1 where f(I) is a function of intensity defined by Fit type, 3: error bars estimated from the variance of difference between data points and the linear interpolation between selected points.)
  • Epsilon for standard errors : If the errors bar code is set to 1, the error bars are defined by s = Ö{f(I)+ (ef(I))2} . e give the ratio of systematic error.
  • Scale A and shift S factors : For comparison with data, the calculated intensity is renormalized in the following way: I ® A×[I/(Imax)] + S, where A,S are the scale and shift factor for the intensity. Moreover, the origin of the reciprocal space can be fitted as a free parameters and is defined through the shifts factors on the angles (2q,af) which are called St,Sa. A logical value (T or F) indicates if A,S,St,Sa should be fitted or held fixed. It is advised to always fit A.
The c2 minimization is always applied to the function f(A×[I/(Imax)] + S). The outputs (file or graphics) concern only this function f. The local gradient is always computed numerically by forward differences:
y

a
ö
ø


a0 
@ y[a0 (1+e)]-y[a0]

ea0
(3.14)
In an analogous way to the c2 definition, to characterize the quality of a fit, the RB factor for cross section number k is defined by :
RB(k) =
N
å
ik=1 
 |Icalck,ik-Iobsk,ik |

N
å
ik=1 
 |Icalck,ik |
.
(3.15)
Once again, the RB is defined on f(I). The expected RB factor is defined as :
RBexp(k) =   æ
Ö

N-f

N
å
ik=1 
 (Iobsk,ik/sk,ikobs) 2
 
.
(3.16)
and the goodness of the fit cg by:
cg(k) =
Ö
 

RB(k)/RBexp(k)
 
.
(3.17)
The total values are given by:
RB = n
å
k=1 
 wk RB(k);     cg = n
å
k=1 
 wk cg(k).
(3.18)

3.4.2  The *.dat file

The various experimental data are put in a separated file *.dat in the format T,sin(2q),sin(a),I,sI. The first column made of bolean (T,F) allows to define excluded areas for the fit process i.e. for the calculation of c2. All the points between two T are excluded. sI is optional and if absent it is calculated from the intensity following the code Error Bar. Below the four lines of comments, one puts:
  • Weight: The weight of the cross section wk.
  • Scale factor: The scale factor of the cross section with hard bounds below.
  • Shift factor: The shift factor of the cross section with hard bound below.
  • DeltaOmega(deg) : The azimuthal orientation of the sample with respect to the beam for the cross section. The origin is arbitrary and can be fitted with the angle parameters xi,z.
  • DeltaAlphai(deg) : The relative incident angle for the cross section with respect to the value given in the *.inp file. The origin is arbitrary and can be fitted.
Scale and shift factors can be fitted independently for each cross section. In this case, it is advised to keep fixed the overall scale factor A.
Fig. 3.7 depicts the format for the data file.
#################################
# Parallel cross section at alphaf=1deg
# Image test
# Weight,Scale factor,Shift factor,
1.1. F0. F
F FF F
F FF F
# DeltaOmega(deg),DeltaAlphai(deg)
0. 0.
# Fitted, Sin(2Thetaf),Sin(Alphaf), Intensity, Error bars
T 0 0.0174524 69290.1
T 0.000468164 0.0174524 68691.2
T 0.000936329 0.0174524 66955.3
T 0.00140449 0.0174524 64264.3
...............................
T 0.0688201 0.0174524 11.6726
T 0.0692883 0.0174524 11.4518
T 0.0697565 0.0174524 11.2475
##################################
# Perpendicular cross section at 2theta=1deg
# Image test
# Weight,Scale factor,Shift factor,
1.1. F0. F
F FF F
F FF F
# DeltaOmega(deg),DeltaAlphai(deg)
0. 0.
# Fitted, Sin(2Thetaf),Sin(Alphaf), Intensity, Error bars
T 0.01745240.00046816470.1678
T 0.01745240.000936329284.976
T 0.01745240.00140449658.752
...............................
T 0.01745240.068820133.54
T 0.01745240.069288332.1555
T 0.01745240.069756530.7835
###################################
Figure 3.7: A typical data file *.dat

3.4.3  Using linear constraints between parameters : the *.mat file

Linear constraints between fitted parameters are implemented in IsGISAXS through a inferior diagonal matrix A (i.e. Anm=0 for m > n) and a column vector b read in a *.mat file. Let call x the column vector of the parameters that are varying in practice during the fit procedure. The parameters y which are used as inputs in the actual calculation are given by:
yn =
å
m 
Anm xm + bm.
(3.19)
After having loaded the three files *.inp,*.fit,*.dat, use the button Constraints in the Start menu and export a template for the *.mat file. It is recorded under same directory as the *.fit file and with same name but with the *.mat extension. This file contains a recall of the all fitted parameters x in the *.fit file and the matrix A equal to the unit matrix. The user has to fulfil this matrix with the desired constraints. The following example Fig. 3.8 shows a typical file.
#================================================================================================
# MATRIX OF CONSTRAINTS
#================================================================================================
Shift 1 2 3 4 5 6 7 8 9 10 11 12
0.0E+00 1 1.0E+00
0.0E+00 2 0.0E+00 1.0E+00
0.0E+00 3 0.0E+00 0.0E+00 1.0E+00
0.0E+00 4 0.0E+00 0.0E+00 0.0E+00 1.0E+00
0.0E+00 5 0.0E+00 0.0E+00 0.0E+00 0.0E+00 1.0E+00
0.0E+00 6 0.0E+00 0.0E+00 0.0E+00 0.0E+00 0.0E+00 1.0E+00
1.0E+00 7 0.0E+00 0.0E+00 -1.0E+00 0.0E+00 0.0E+00 0.0E+00 0.0E+00
0.0E+00 8 0.0E+00 0.0E+00 0.0E+00 1.0E+00 0.0E+00 0.0E+00 0.0E+00 0.0E+00
0.0E+00 9 0.0E+00 0.0E+00 0.0E+00 0.0E+00 0.0E+00 0.0E+00 0.0E+00 0.0E+00 1.0E+00
0.0E+00 10 0.0E+00 0.0E+00 0.0E+00 0.0E+00 0.0E+00 2.0E+00 0.0E+00 0.0E+00 0.0E+00 0.0E+00
0.0E+00 11 0.0E+00 0.0E+00 0.0E+00 0.0E+00 0.0E+00 0.0E+00 0.0E+00 0.0E+00 0.0E+00 0.0E+00 1.0E+00
0.0E+00 12 0.0E+00 0.0E+00 0.0E+00 0.0E+00 0.0E+00 0.0E+00 0.0E+00 0.0E+00 0.0E+00 0.0E+00 0.0E+00 1.0E+00
#================================================================================================
1 1 # Scale factor : 1.0E+05
2 2 # Shift factor : 1.0E+01
3 3 # ( 1) Particle probability : 4.0E-01
4 4 # ( 1) Particle radius (nm) : 4.0E+00
5 5 # ( 1) Dispersion in radius : 2.0E-01
6 6 # ( 1) Height aspect ratio : 8.0E-01
7 7 # ( 2) Particle probability : 6.0E-01
8 8 # ( 2) Particle radius (nm) : 4.0E+00
9 9 # ( 2) Dispersion in radius : 2.0E-01
10 10 # ( 2) Height aspect ratio : 8.0E-01
11 11 # D (nm) : 1.2E+01
12 12 # w (nm) : 6.0E+00
Figure 3.8: A typical input file *.mat
In this case, the constraints are:
p2 = 1 - p1;     R2 = R1;     (H/R)2 = 2 (H/R)1
(3.20)
where the index 1,2 refer to the particle type.

3.5  The batch file *.bah

An example of *.bah file is shown on Fig. 3.9. The batch file *.bah is used to launch automatically a set of simulations or fits.
##############################################
#
# GISAXS BATCH FILE
#
##############################################
# Number of jobs
3
# Type of simulation (0=simulation, 1=pre_fit 2=fit) and filenames (*.inp,*.fit,*.dat,*.mor)
0
d:/IsGISAXS/in1.inp
d:/Trash/in1.fit
d:/Trash/in1.dat
d:/Trash/in1.mor
2
d:/IsGISAXS/in2.inp
d:/IsGISAXS/in2.fit
d:/IsGISAXS/in2.dat
d:/IsGISAXS/in2.mor
0
d:/IsGISAXS/in3.inp
d:/Trash/in3.fit
d:/Trash/in3.dat
d:/IsGISAXS/in3.mor
Figure 3.9: A typical batch file *.bah
The following items appear in such a file:
  • Number of jobs : the total number of jobs that are foreseen
  • Type of simulation and filenames : the desired type of calculation is given by 0: simulation, 1:pre-fit, 2: fit; 3: simulated annealing this value is followed by 4 lines which give the full path to, respectively, the *.inp,*.fit,*.dat,*.mor used files. If a a file is useless, the line is still needed for a correct reading but it will be skipped during the job. If linear constraints are desired, the file *.mat with the same name and in the same directory as the *.fit should exist.

3.6  The Quick Fit option

The Quick Fit option is activated from the Start menu. It is aimed at fitting one parallel cross section (along 2qf) with a 1D-SSCA model (see Sect. 2.2.3) in an interactive way. The particle sizes R are normally distributed (mean value R0 - variance sR) while the underlying paracrystal with mean spacing D obeys a gaussian statistics (variance sD). The particles are either 1D (sticks), 2D (square) or 3D (cubes). Their shape can be folded with a lorentzian leading to a extra decrease of their form factor exp(-qy R0 w).
The button activates the windows shown on Fig. 3.10.
figures/chap2/boxquickfit.gif
Figure 3.10: The Quick Fit windows.
All the fit parameters (R,sR,D,sD,k,w,A,S,l,ai) and their activation (Hold tick box) can be modified on line. No *.inp,*.fit file are necessary. However, a correct *.dat file with one parallel cross section should have been already loaded. The number of interpolation points as well as the dimensionality of the particle can be modified on line. The Plot button of windows Fig. 3.10 allows to compare the start point of the simulation and the data curve. The Fit button launches the classical fit process using the c2 minimization. The fit results (file or curve) can be displayed as already explained.

3.7  The output files *.out,*.pro,*.ima,*.ki2,*.cor,*.dwba,*.bin

The outputs are written in ASCII files with the Base filename plus a special extension:
  • *.out: The main outputs. For a simulation this file contains as function of:
    sin(2q),sin(a),qx,qy,q|| =
    Ö
     

    qx2+qy2
     
    ,qz :
    (3.21)
    • the GISAXS intensity,
    • the interference function: S(q||),
    • the form factors: | < F > |2, < |F|2 > , the diffuse scattering, < |F|2 > -| < F > |2,
    • the structure factor for a regular lattice FS,
    • possibly, the reflectivity.
    The form factors and the GISAXS are in fact the scattering cross section (expressed in nm2 without normalization by re r0) defined in Eq. (2.50-2.52) multiplied by (re r0)2. For a fit or a pre-fit, for each cross section, one finds:
    • the fitted GISAXS,
    • the data with the used error bars,
    • the difference between simulation and fit.
    Moreover, various information like the mean particle sizes (radius, height, width) for the simulation or the fit are given in the header of the file. The gyration radius is the radius generated by the rotation of the particle around the symmetry axis perpendicular to the substrate. The mean aspect ratios are defined as the true height divided by the in-plane radius R of Fig. 2.2-2.3-2.4 averaged over all possible values. In the case of a distribution of incident angles ai or wavelength l , the values for the wavevector transfer are given for the mean value < ai > and < l > .
  • *.pro : The output file for the probability densities of l,ai,z,R,W,H,xi,DL and for the profile of refraction index.
  • *.ima,*.bin: The desired image (GISAXS, form factor, interference function) as an ASCII array or as a binary format file (4 bytes real).
  • *.cor: The pair correlation function file.
  • *.dwba: The file for the four terms of the DWBA form factor (module and phase).
  • *.ki2: The copy of the standard output in the case of a fit or simulated annealing.
If a classical fit is performed, at the end of the *.ki2 file, there are the curvature A and covariance C matrix defined by:
Akl
=
1

2
c2

ak al
ö
ø


end 
Ckl
=
[ A ]-1kl
(3.22)
where ak is the kth fitted parameter and the partial derivatives are calculated at the best found position in the parameter space. The standard errors for the fitted parameters are defined as the square-root of the diagonal elements of the covariance matrix C. A careful analysis of the covariance matrix allows to detect strongly coupled parameters with the chosen definition of c2.
The name of the output file (*.out) as well as the c2 file (*.ki2) is automatically incremented with a counter to avoid scratching the previous results.


Chapter 4
IsGISAXS : Typical examples and capabilities

In order to highlight the software capabilities, various examples of input files are given with the distribution.
In this section, all the images are displayed in logarithmic scale with the horizontal axis proportional to sin(2q) and the vertical one to sin(af) or to the wavevector transfers (qx,qy,qz) . The chosen wavelength is l = 0.1 nm and the angles of incidence is fixed at ai=ac=0.2°,qi=0° if not specified. The indexes of refraction of the substrate are fixed to ds=5. 10-6,bs=2. 10-8 and that of the particle to di=5. 10-5,bi=2. 10-8.

4.1  The form factor

4.1.1  Distorted Wave Born Approximation and the refraction effect

As shown in Sect. 2.4 and in particular in Fig. 2.9, the treatment in DWBA is a prerequisite for a correct description of the scattering phenomenon. For islands on a substrate, the figure Fig. 4.1 shows that the maximum of intensity is obtained at the critical angle when the four DWBA terms interfere coherently.
figures/chap3/cylinder.gif
Figure 4.1: Calculated form factor for a cylinder (R=5 nm; H/R=1) for 0 < 2 q < 2°; 0 < af < 2° in the Distorted Wave Born Approximation for two angles of incidence a) ai=ac and b) ai=2ac. Same color scale.

4.1.2  The island facetting

An anisotropic shape is able to generate an anisotropy of scattering as function of the angle z between the island edge and the incident beam. Some rods of scattering by facets appear clearly in Fig. 4.2 for a pyramidal island. For z = 0°, the direction of scattering is exactly at the complementary angle of the facets angle (35.27°=90°-54.73°).
figures/chap3/facette.gif
Figure 4.2: Calculated form factor for a truncated pyramid (R=5 nm; H/R=1; a = 54.73° angle between (111) and (100) planes in cubic system) at ai=ac for 0 < 2 q < 3°; 0 < af < 3° in the Distorted Wave Born Approximation for two angles between the direct beam and the island edge a) z = 0° b) z = 45°.

4.1.3  The island sizes distribution

For a monodisperse size distribution, sharp interferences fringes (called Kiessig fringes in reflectivity) appear at roughly q|| ~ 2p/R or q^ ~ 2p/H. These fringes are associated to the zero of the sine cardinal or Bessel function for simple shapes like parallelepiped or cylinder. The figure Fig. 4.3 illustrates the smoothing of these fringes upon increasing the width of the size distribution. In this case a Guinier analysis at small scattering vector is tractable [1,39] as interference function does not perturb the form factor.
figures/chap3/cylinder_size.gif
Figure 4.3: Cross section along q|| at a = ac for the mean form factor < |F|2 > of a cylinder (Born Approximation). The size distribution is gaussian (R0=5 nm) with various broadening s/R).
The size and height distribution for the pyramidal shape sheds light on the rod of scattering by facets as underlined in Fig. 4.4 by smoothing out all the sharp minima which appeared in Fig. 4.2.
figures/chap3/pyramid_size.gif
Figure 4.4: Mean form factor < |F|2 > for a gaussian distribution of pyramidal shape island (R0=5 nm-s/R=0.2). Same parameters as Fig. 4.2.
The IsGISAXS program is also able to handle a mixture of island shapes. The simplest is given by a bimodal size distribution which is illustrated in Fig. 4.5. The oscillation fringes are strongly influenced by the bigger particles as in GISAXS the scattering cross section is proportional to the volume square.
figures/chap3/bimodal.gif
Figure 4.5: Same simulation parameters as in Fig. 4.3 except that the island distribution is bimodal with various proportions between the two gaussian size cylinder distributions (s1/R=0.25,s2/R=0.02).

4.2  The interference function

4.2.1  Non regular lattice and the pair correlation function

The main influence of the interference function is to shift the maximum of the intensity of the form factor located at qy = 0. The figures Fig. 4.6-4.7 illustrate this in the case of the simple Debye hard core model and of the isotropic paracrystal interference function. Notice that, because of the slope of the mean form factor, the maximum of the intensity is not located at the maximum of the interference function which means that this position can not give with certainty the mean interparticle distance. As usual in scattering at small angles, this interplay between the interference function and the form factor often prevents to perform the classical Guinier analysis [1]; it implies a full treatment of all the scattering curve to extract reliable parameters. Moreover, the DA model generates a strong diffuse scattering Id(q) around the specular rod contrary the LMA model (see Fig. 4.7).
figures/chap3/interference.gif
Figure 4.6: a) GISAXS pattern computed between -1.2° < 2 q < 1.2°;0 < af < 1.5° using the LMA model (see Sect. 2.2). The DWBA form factor is that of a cylinder with the morphological parameters: R=5 nm-H/R=1-s/R=0.2 (gaussian). The interference function is given by the Debye model with a hard core radius of R0=7.5 nm and a density rS=0.001 nm-2. b) Cross section at af=0.2° of left image showing the intensity, the form factor and the interference function.
figures/chap3/DALMA.gif
Figure 4.7: GISAXS patterns computed between -0.5° < 2 q < 0.5°;0 < af < 1° using the a) DA b) LMA models (see Sect. 2.2). The DWBA form factor is that of a cylinder with the morphological parameters: R0=5 nm-H0/R0=1-s/R=0.5 (gaussian). The interference function is given by the isotropic paracrystal model model with a preferential distance D=20 nm and a gaussian disorder w/D=0.25. c) Cross section at af=0.2° of both images showing the intensity, the mean form factor, the incoherent signal and the interference function.

4.2.2  Regular lattice

For a regular lattice, the interference function is made of diffraction rods perpendicular to the surface; their widths are inversely proportional to the correlation length L. In this case, the GISAXS pattern can be interpreted in terms of the Ewald construction as shown in Fig. 4.8.
figures/chap3/ewald.gif
Figure 4.8: The Ewald construction in the case of bidimensional regular lattice.
figures/chap3/lattice.gif
Figure 4.9: The GISAXS pattern in the case of a regular square lattice of size a=b=10 nm with a correlation length of L = 200 nm seen between 0 < 2 q < 1.5°; 0 < af < 1.5° for two orientations with respect to the incident beam a) xi=0° b) xi=1.5°. The form factor is that of a cylinder (R=2 nm;H/R=1).
The directions of scattering are given by the intersection of the Ewald sphere and of the rods of scattering. In the small angle range and for typical island spacing, only the first and second order of diffraction can be seen. For an angle between ki|| and the lattice xi=0, these rods are tangential to the Ewald sphere leading to rods on the GISAXS image (Fig. 4.9-a). By rotating slightly the lattice, the first and second rods drills the Ewald sphere at af ¹ 0 leading to a concentration of intensity in a out of plane spot (see Fig. 4.9-b).
A plot in the (qx,qy)-plane at qz=0 allows to visualize the traces of the rods without satisfying the constraint of Ewald construction i.e. ki=kf (Fig. 4.10). Fig. 4.10 also shows that the variants can be accounted for in IsGISAXS .
figures/chap3/2D-qxqy-a.gif
Figure 4.10: The interference function in the (qx,qy)-plane at qz=0 for a square regular lattice of size a=b=10 nm with anisotropic correlation lengths La=300 nm, Lb=100 nm. The chosen rod shape is an ellipsoid of lorentzian shape (Eq. (2.90)). The image is plotted between qx=-1,1 nm-1 and qy=-1,1 nm-1 on a logarithmic scale.
figures/chap3/2D-qxqy-b.gif
Figure 4.11: Same as in Fig. 4.10 except that three variants rotated by 120° have been accounted for.

4.2.3  Paracrystal

Fig. 4.12 shows appear the loss of long range order in the paracrystal model. Even though the chosen probability density is isotropic, the convolution along the paracrystal axis leads to some anisotropy in the interference function along the diagonal direction.
figures/chap3/2DDL-qxqy.gif
Figure 4.12: The ideal paracrystal interference function plotted in the (qx,qy)-plane at qz=0 for a square 10×10 nm lattice. The probability densities are chosen as 2D-exponential according to Eq. (2.123) with an isotropic disorder parameter w = 0.5 nm. The image is plotted between qx=0.1,2.1 nm-1 and qy=0.1,2.1 nm-1 to avoid the divergence at the origin.

4.2.4  The reflectivity

Fig. 4.13 shows the calculated reflectivity curve at fixed incidence angle ai=0.2° versus af for an island layer compared to that of the bare substrate. The reflectivity was calculated using the Parratt principle.
figures/chap3/reflectivity.gif
Figure 4.13: Integrated reflectivity of a monodisperse layer of cylinders (R0=H0=5 nm) covering 3% of the substrate in the DWBA.


Chapter 5
Future developments-improvements

The forthcoming developments for the program IsGISAXS are the following:
  • a version of IsGISAXS running under Unix or Linux operating system;
  • cylindrically averaged diffraction by distorted lattices
  • better paracrystal description
  • accounting for the experimental point spread function
  • ....
Of course, a constant improvement of the working environments is under progress (graphical outputs, error messages etc ...).


Chapter 6
License agreement

The program IsGISAXS was developed by Rémi Lazzari from CNRS (Institut des NanoSciences de Paris, France). A package including the executable file, the source codes, the manual and some examples of input files an be downloaded from https://w3.insp.jussieu.fr. IsGISAXS is freely available under the GNU General Public License agreement (see http://opensource.org/licenses/gpl-license.php) for non-commercial use, and is provided as-is without any warranty. The author disclaims any problems which could result from the use of the program.
The author would appreciate that any publication resulting from use of this software acknowledges its use by citing the reference:
ÏsGISAXS: a program for Grazing-Incidence Small-Angle X-Ray Scattering analysis of supported islands", R. Lazzari, Appl. Cryst. 35,406-421 (2002).

Bibliography

[1]
A. Guinier and G. Fournet. Small-angle scattering of X-rays. Jonh Wiley & Sons, New York, 1955.
[2]
G. Glatter and O. Kratky. Small angle X-ray scattering. Academic Press, 1982.
[3]
P. Lindner and Th. Zemb. Neutron, X-ray and light scattering: introduction to an investigative tool for colloidal and polymeric system. Elsevier, Amsterdam, 1991.
[4]
J. S. Higgins and H. C. Benoît. Polymers and neutron scattering. Clarendon Press, Oxford, 1994.
[5]
J. Als-Nielsen and D. McMorrow. Elements of modern X-ray physics. John Wiley & Sons, New York, 2001.
[6]
S. Dietrich and A. Haase. Scattering of X-rays and neutrons at interfaces. Phys. Rep., 260:1-138, 1995.
[7]
I. K. Robinson. Surface crystallography, volume 3. Elsevier, Amsterdam & New York, 1991.
[8]
H. Dosch. Critical phenomena at surfaces and interfaces: Evanescent X-ray and neutron scattering. Springer-Verlag, Berlin, 1992.
[9]
G. Renaud. Oxide Surfaces and Metal/Oxide Interfaces Studied by Grazing Incidence X-Ray Scattering. Surf. Sci. Rep., 32:1-90, 1998.
[10]
S. K. Sinha, E. B. Sirota, S. Garoff, and H. B. Stanley. X-ray and neutron scattering from rough surfaces. Phys. Rev. B, 38(4):2297-2311, 1988.
[11]
V. Holý, J. Kubuena, I. Ohlídal, K. Lischka, and W. Plotz. X-ray reflection from rough layered systems. Phys. Rev. B, 47(23):15896-15903, 1993.
[12]
V. Holý and T. Baumbach. Non specular X-ray reflection from rough multilayers. Phys. Rev. B, 49(15):10668-10676, 1994.
[13]
D. K. G. Boer. Influence of the roughness profile on the specular reflectivity of X-rays and neutrons. Phys. Rev. B, 49(9):5817-5820, 1994.
[14]
T. H. Metzger, I. Kegel, R. Paniago, A. Lorke, J. Peisl, J. Schulze, I. Eisele, P. Schittenhelm, and G. Abstreiter. Shape, size, strain and correlations in quantum dot systems studied by grazing incidence X-ray scattering methods. Thin Solid Films, 336(8):1-8, 1998.
[15]
T.H. Metzger, I. Kegel, R. Paniago, and J. Peisl. Grazing incidence X-ray scattering: an ideal tool to study the structure of quantum dots. J. Phys. D: Appl. Phys., 32:A202-A207, 1999.
[16]
I. Kegel, T. H. Metzger, and J. Peisl. Lateral ordering of coherent Ge islands on Si(001) studied by triple-crystal grazing incidence diffraction. Appl. Phys. Lett., 74(20):2978-2980, 1999.
[17]
J. Stangl, V. Holý, P. Mikulik, G. Bauer, I. Kegel, T. H. Metzger, O. G. Schmidt, C. Lange, and K. Eberl. Self-assembled carbon-induced germanium quantum dots studied by grazing-incidence small-angle scattering. Appl. Phys. Lett., 74(25):3785-3787, 1999.
[18]
K. Zhang, Ch. Heyn, W. Hansen, Th. Schmidt, and J. Falta. Grazing incidence structural characterization of InAs quantum dots on GaAs(001). Appl. Surf. Sci., 175-176:606-612, 2001.
[19]
B. M. Lairson, A. P. Payne, S. Brennan, N. M. Rensing, B. J. Daniels, and B. M. Clemens. In situ X-ray measurements of the initial epitaxy of Fe(0001) films on MgO(001). J. Appl. Phys., 78(7):4449-4455, 1995.
[20]
O. Robach, G. Renaud, and A. Barbier. Structure and morphology of the Ag/MgO(001) interface during in situ growth at room temperature. Phys. Rev. B, 60(8):5858-5871, 1999.
[21]
G. Renaud, R. Lazzari, C. Revenant, A. Barbier, M. Noblet, O. Ulrich, F. Leroy, J. Jupille, Y. Borenstzein, C. R. Henry, J. P. Deville, F. Scheurer, J. Mane-Mane, and O. Fruchart. Real time in situ quantitative study of growing islands by grazing incidence small-angle x-ray scattering submitted to science. Science, 300:1416-1419, 2003.
[22]
I. Kegel, T. H. Metzger, J. Peisl, J. Stangl, G. Bauer, and D. Smilgies. Vertical alignment of multilayered quantum dots studied by X-ray grazing-incidence difraction. Phys. Rev. B, 60(4):2516-2521, 1999.
[23]
J Stangl, V; Holý, T. Roch, A. Daniel, G. Bauer, J. Zhu, K. Brunner, and G. Abstreiter. Grazing incidence small angle x-ray scattering study of buried and free-standing SiGe islands in a SiGe/Si superlattice. Phys. Rev. B, 62(11):7229-7236, 2000.
[24]
V. Holý, J. Stangl, G. Springholz, M. Pinceolits, and G. Bauer. High resolution x-ray diffraction from self-organized PbSe/PbEuTe quantum dots superlattices. J. Phys. D: Appl. Phys., 34:A1-A5, 2001.
[25]
V. Holý, T. Roch, J. Stangl, A. Daniel, G. Bauer, T. H. Metzger, Y. H. Zhu, K. Brunner, and G. Abstreiter. Grazing incidence small-angle x-ray scattering study of self-organized sige wires. Phys. Rev. B, 63:205318-, 2001.
[26]
M. Rauscher, T. Salditt, and H. Spohn. Small-angle X-ray scattering under grazing incidence: the cross section in the distorded-wave Born approximation. Phys. Rev. B, 52(23):16855-16863, 1995.
[27]
M. Rauscher, R. Paniago, H. Metzger, Z. Kovats, J. Domke, H. D. Pfannes, J. Schulze, and I. Eisele. Grazing incidence small angle X-ray scattering from free-standing nanostructures. J. Appl. Phys., 86(12):6763-6769, 1999.
[28]
R. Lazzari. IsGISAXS: a program for grazing-incidence small-angle x-ray scattering analysis of supported islands. J. Appl. Cryst., 35:406-421, 2002.
[29]
J. Daillant and A. Gibaud. X-ray and neutron reflectivity : principle and applications. Lectures notes in physics. Springer, 1999.
[30]
J. R. Levine, J. B. Cohen, Y. W. Chung, and P. Georgopoulos. Grazing incidence small angle x-ray scattering: a new tool for studying thin film growth. J. Appl. Cryst., 22:528-532, 1989.
[31]
Y. Waseda. The structure of non-crystalline materials. Mc. Graw-Hill, New-York, 1980.
[32]
C. Revenant, F. Leroy, R. Lazzari, G. Renaud, and C.R. Henry. Quantitative analysis of grazing incidence small angle x-ray scattering: Pd/mgo(001) growth. Phys. Rev. B, 69:035411-1, 2004.
[33]
F. Leroy, R. Lazzari, and G. Renaud. Effects of near-neighbor correlations on the diffuse scattering from a one-dimensional paracrystal. Acta. Cryst. A, 60:565-581, 2004.
[34]
R. Lazzari, F. Leroy, and G. Renaud. Grazing incidence small angle x-ray scattering from islands on surfaces. part i : beyond classical analysis approximations. submitted to Phys. Rev. B, 2006.
[35]
R. Piessens, E. deDoncker Kapenga, C. Uberhuber, and D. Kahaner. Quadpack: a Subroutine Package for Automatic Integration. Series in Computational Mathematics v.1. 1983.
[36]
http://www.netlib.org.
[37]
A. Messiah. Quamtum mechanics, volume 1-2. Dunod, Paris, 1964.
[38]
R. Lazzari, F. Leroy, G. Renaud, and J. Jupille. Grazing incidence small angle x-ray scattering from islands on surfaces. part ii: the growth mode of au particles on tio2(110). 2006.
[39]
A. Guinier. X-ray diffraction in crystals, imperfect crystals and amorphous bodies. Dover Publications, Inc, New York, 1963.
[40]
R. Hosemann and S. N. Bagchi. Direct analysis of diffraction by matter. North-Holland Publishing Company, Amsterdam, 1962.
[41]
O. Robach. Etude in situ de la croissance de Ag sur MgO(100) et de Ni/Ag(001) et de la nitruration du GaAs par diffusion de rayons X en incidence rasante. PhD thesis, Université Joseph Fourier Grenoble I, France, 1997.
[42]
P. W. Zhu and J. W. White. Small angle X-ray scattering of an ordering aggregation. J. Chem. Phys., 22(8):9169-9173, 1996.
[43]
J. A. Venables. Rate equations approaches to thin film nucleation kinetics. Phil. Mag., 27(3):697-738, 1973.
[44]
M. Baus and J. L. Colot. Thermodynamics and structure of a fluid of hard rods, disks, spheres or hyperspheres from rescaled virial expansion. Phys. Rev. A, 36(8):3912-3925, 1987.
[45]
R. Hosemann, W. Vogel, and D. Weick. Novel aspects of the real paracrystal. Acta. Cryst. A, 37:85-91, 1981.
[46]
H. Matsuoka, H. Tanaka, T. Hashimoto, and N. Ise. Elastic scattering from cubic lattice systems with paracrystalline distortion. Phys. Rev. B, 36(3):1754-1765, 1987.
[47]
Xiang-Qi Mu. X-ray diffraction by one-dimensional paracrystal of limited size. Acta. Cryst. A, 54:606-616, 1998.
[48]
L.G. Parratt. Surface studies of solids by total reflection of x-rays. Phys. Rev., 95:359-369, 1954.
[49]
http://developer.intel.com/software/products/.
[50]
T. Pearson. http://www.astro.caltech.edu/ tjp/pgplot.
[51]
W. H. Press, S. A. Teukolsky, W. T. Vetterling, and B. P. Flannery. Numerical Recipes in Fortran. Cambridge University Press, 1992.

List of Figures

    1.1  The scattering and diffraction ranges versus the wavevector transfer.
    2.1  The grazing incidence geometry: an incident wave of wavevector \@mathbf ki is scattered in the direction \@mathbf kf.
    2.2  Supported geometries for particle shapes in IsGISAXS (Left: side view - Right: top view).
    2.3  Supported geometries for particle shapes in IsGISAXS (Left: side view - Right: top view).
    2.4  Supported geometries for particle shapes in IsGISAXS .
    2.5  The core shell particle.
    2.6  The particle layer geometry developed in IsGISAXS .
    2.7  The four terms involved in the scattering by a supported island. The first term corresponds to the simple Born approximation.
    2.8  The interference fringes for the form factor of a cylinder of height H=5 nm (l = 1  A-d = 5 10-6,b = 2 10-8) as function of the exit angle af normalized by the angle of total external reflection ac within the various approximations: BA, DWBA(ai=ac/2,ac,2ac), effective layer BA(ai=ac).
    2.9  The modulus square of the four terms Fig. 2.7 for a cylinder as function of af for various ai: Term 1(red)-Term 2(green)-Term 3(orange)-Term 4(blue) (same parameters as in Fig. 2.8).
    2.10  The phase of the four terms Fig. 2.7 for a cylinder as function of af for various ai: Term 1(red)-Term 2(green)-Term 3(orange)-Term 4(blue) (same parameters as in Fig. 2.8).
    2.11  Schematic drawing of the slicing of graded interface \mathaccent "0365\relax n0(z) used in Eq. 2.56. The formalism is more general that the case of islands depicted here.
    2.12  The hard-core pair correlation function a) and the interference function b) as function of the surface coverage h = rS ps2/4, with s the hard core diameter. The functions are plotted against reduced parameters r/s and qs/2p.
    2.13  Sketch of the orientation of the principal axis of the rod.
    2.14  The schematic view of the one dimensional paracrystal.
    2.15  The pair correlation function a) and the interference function b) in the case of the 1D paracrystal for various disorder parameter w/D.
    2.16  The schematic view of a paracrystal in two dimensions. Each circle represents the area where the probability of finding one particle is maximum.
    2.17  Sketch of 2D paracrystal probability ellipsoids orientation.
    2.18  The interference function a) and the pair correlation function b) for a paracrystal of hexagonal symmetry averaged over all the azimuths xi. The gaussian disorder parameter w/D is indicated on figure. The axis are normalized by the lattice parameter D and the expected peaks position 1,Ö3,2,Ö7,3,2Ö3,Ö{13},4 are marked with a circle.
    2.19  The stacking of N-layers along the normal to the substrate is used to compute the reflectivity from the Parratt recursive principle.
    3.1  The "Calculation Parameters", the "Fit Parameters", the "Matrix of Constraints" and the "Simulated Annealing" boxes.
    3.2  The "Graph Parameters", the Ïmage Parameters" and the Äutodisplay" boxes.
    3.3  1214.5 plus3 minus7 plus3 plus3.5 minus3 plus2.5 minus plus4 minus6 plus2.5 minus plus2.5 minus plus4 minus6 plus2.5 minus A typical input file *.inp
    3.4  Relative orientation of the particles with respect to the beam or the lattice.
    3.5  A typical morphology file *.mor
    3.6  A typical input file *.fit for data fitting
    3.7  A typical data file *.dat
    3.8  1214.5 plus3 minus7 plus3 plus3.5 minus3 plus2.5 minus plus4 minus6 plus2.5 minus plus2.5 minus plus4 minus6 plus2.5 minus A typical input file *.mat
    3.9  A typical batch file *.bah
    3.10  The Quick Fit windows.
    4.1  Calculated form factor for a cylinder (R=5 nm; H/R=1) for 0 < 2 q < 2°; 0 < af < 2° in the Distorted Wave Born Approximation for two angles of incidence a) ai=ac and b) ai=2ac. Same color scale.
    4.2  Calculated form factor for a truncated pyramid (R=5 nm; H/R=1; a = 54.73° angle between (111) and (100) planes in cubic system) at ai=ac for 0 < 2 q < 3°; 0 < af < 3° in the Distorted Wave Born Approximation for two angles between the direct beam and the island edge a) z = 0° b) z = 45°.
    4.3  Cross section along q|| at a = ac for the mean form factor < |F|2 > of a cylinder (Born Approximation). The size distribution is gaussian (R0=5 nm) with various broadening s/R).
    4.4  Mean form factor < |F|2 > for a gaussian distribution of pyramidal shape island (R0=5 nm-s/R=0.2). Same parameters as Fig. 4.2.
    4.5  Same simulation parameters as in Fig. 4.3 except that the island distribution is bimodal with various proportions between the two gaussian size cylinder distributions (s1/R=0.25,s2/R=0.02).
    4.6  a) GISAXS pattern computed between -1.2° < 2 q < 1.2°;0 < af < 1.5° using the LMA model (see Sect. 2.2). The DWBA form factor is that of a cylinder with the morphological parameters: R=5 nm-H/R=1-s/R=0.2 (gaussian). The interference function is given by the Debye model with a hard core radius of R0=7.5 nm and a density rS=0.001 nm-2. b) Cross section at af=0.2° of left image showing the intensity, the form factor and the interference function.
    4.7  GISAXS patterns computed between -0.5° < 2 q < 0.5°;0 < af < 1° using the a) DA b) LMA models (see Sect. 2.2). The DWBA form factor is that of a cylinder with the morphological parameters: R0=5 nm-H0/R0=1-s/R=0.5 (gaussian). The interference function is given by the isotropic paracrystal model model with a preferential distance D=20 nm and a gaussian disorder w/D=0.25. c) Cross section at af=0.2° of both images showing the intensity, the mean form factor, the incoherent signal and the interference function.
    4.8  The Ewald construction in the case of bidimensional regular lattice.
    4.9  The GISAXS pattern in the case of a regular square lattice of size a=b=10 nm with a correlation length of L = 200 nm seen between 0 < 2 q < 1.5°; 0 < af < 1.5° for two orientations with respect to the incident beam a) xi=0° b) xi=1.5°. The form factor is that of a cylinder (R=2 nm;H/R=1).
    4.10  The interference function in the (qx,qy)-plane at qz=0 for a square regular lattice of size a=b=10 nm with anisotropic correlation lengths L a=300 nm, L b=100 nm. The chosen rod shape is an ellipsoid of lorentzian shape (Eq. (2.90)). The image is plotted between qx=-1,1 nm-1 and qy=-1,1 nm-1 on a logarithmic scale.
    4.11  Same as in Fig. 4.10 except that three variants rotated by 120° have been accounted for.
    4.12  The ideal paracrystal interference function plotted in the (qx,qy)-plane at qz=0 for a square 10×10 nm lattice. The probability densities are chosen as 2D-exponential according to Eq. (2.123) with an isotropic disorder parameter w = 0.5 nm. The image is plotted between qx=0.1,2.1 nm-1 and qy=0.1,2.1 nm-1 to avoid the divergence at the origin.
    4.13  Integrated reflectivity of a monodisperse layer of cylinders (R0=H0=5 nm) covering 3% of the substrate in the DWBA.

Footnotes:

1The program with instructions is available on simple request to the author or at https://w3.insp.jussieu.fr
2As no dependence of the index of refraction is accounted for, the wavelength distribution should not be two large or should not cross an absorption threshold.


File translated from TEX by TTH, version 3.74.
On 04 May 2006, 17:36.